

OWC Jellyfish Manager 2 Support Manual
Table of Contents
- Overview
- Menu Bar
- Dashboard
- Storage
- Dashboard Live Chart Overview
- Dashboard: CPU Usage
- Dashboard: Disk iO
- Dashboard: Memory
- Dashboard: ZFS Reads
- Dashboard: ZFS Actual Cache Hits
- Dashboard: Temperatures
- Dashboard: Disks
- Dashboard: Connections
- Dashboard: System Time
- Dashboard: History
- Dashboard: Logs
- Dashboard: Updates
- Dashboard: Reboot
- Dashboard: Shutdown
- Shares
- Creating/Customizing Shares
- Quote
- Recycle
- Permissions
- Connected Users
- Snapshots
- NFS Shares
- Creating/Customizing Shares
- Users & Groups
- Creating A New Group
- Creating New Users
- Networks
- Integrations
- Media Engine and Kyno
- System Alerts
- Profile
- Additional Resources
Overview
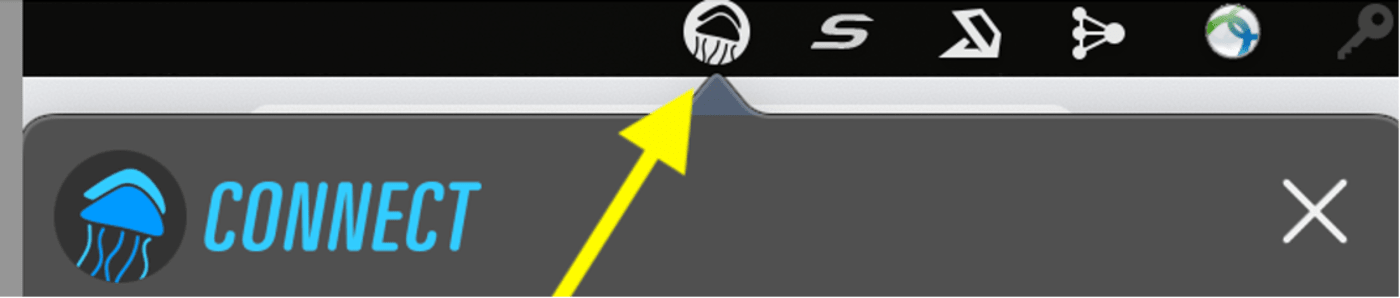
- OWC Jellyfish Manager is your all-inclusive web application that serves as your personal system administrator hub. It can be accessed through Jellyfish Connect, the icon in the toolbar at the top of your screen. Alternately, you can get here by entering jellyfish/login into your browser’s address bar.
1. Click on the Resources tab, this will populate a list of actions and applications, the first of which will read OWC Jellyfish Manager.
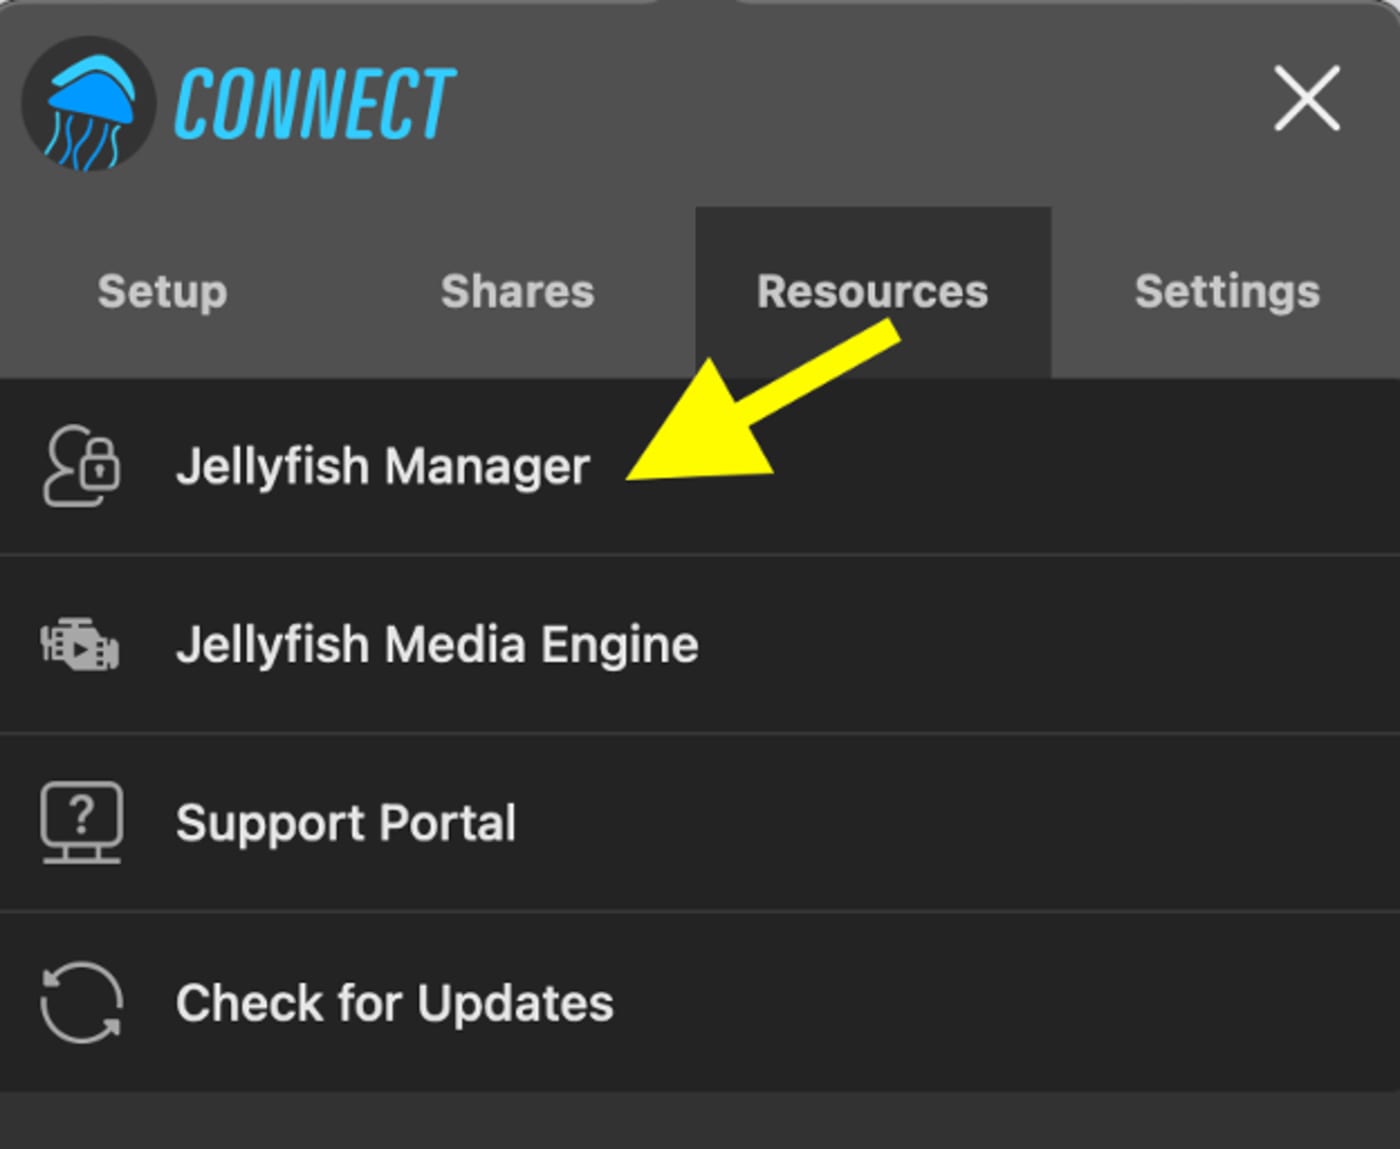
2. When you click OWC Jellyfish Manager, or you enter jellyfish/login into your browser’s address bar, your browser will pop up in a new web browser tab.
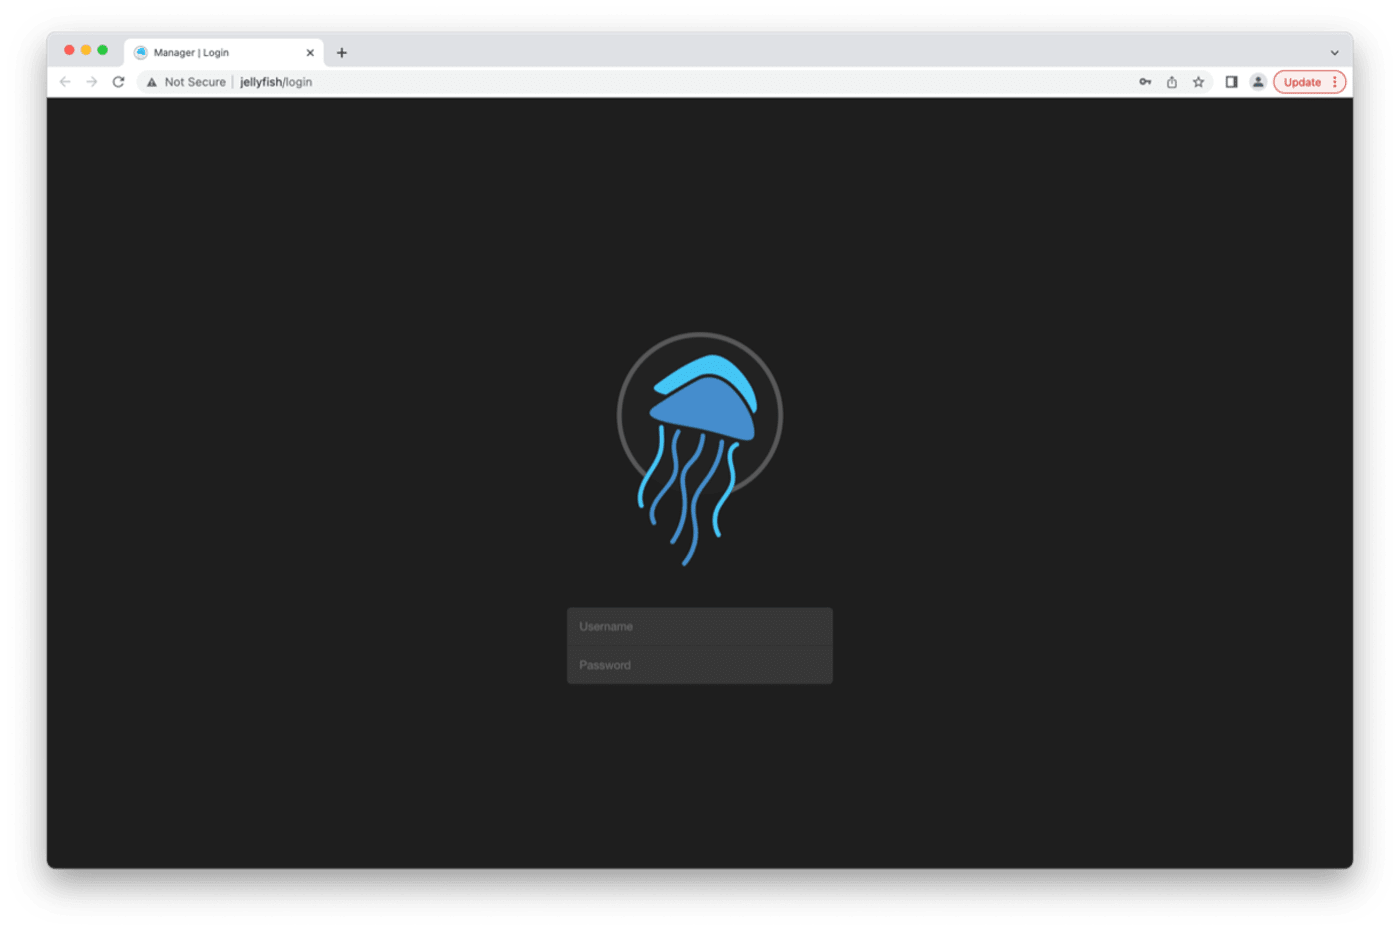
3. This will prompt you for your username and password. (For help setting this up for the first time, please consult our guide to setting up users here.)
4. After entering your login credentials, you’ll be taken to the OWC Jellyfish Manager Dashboard – an at-a-glance snapshot of the shares, storage capacity, users, and health of your OWC Jellyfish. This is always the default first page when logged in.
Menu Bar
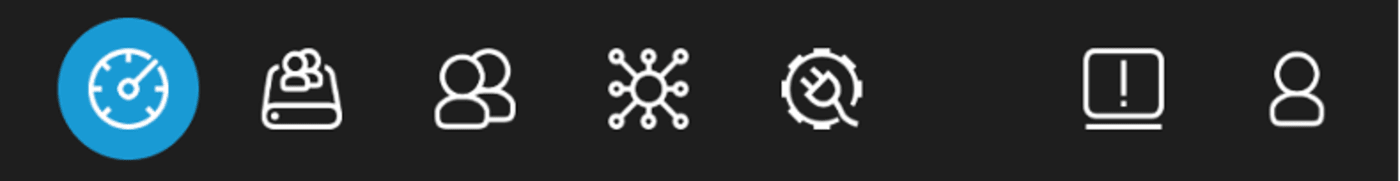
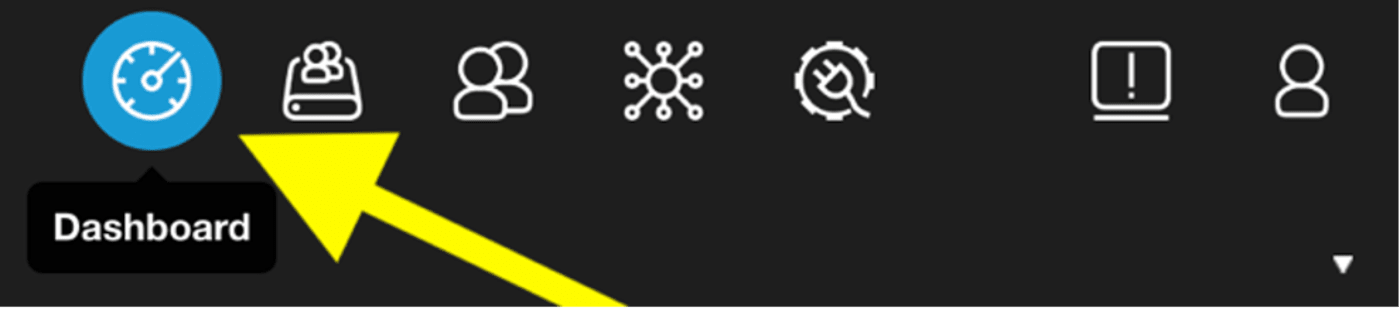
- The top right corner has a menu of quick links that will always be there that take you to the following pages respectively: back to your Dashboard, Shares, Users & Groups, Networks, Integrations, Systems Alerts, and your own administrative profile. We will go through each of these menu items individually at length, so you understand all the information, options, and settings that can be accessed through each of these pages.
Dashboard
- Clicking the Dashboard icon at any time will bring you back to that first page. This will also happen when you click the OWC Jellyfish Manager logo in the top left of the dashboard when logged into OWC Jellyfish Manager.
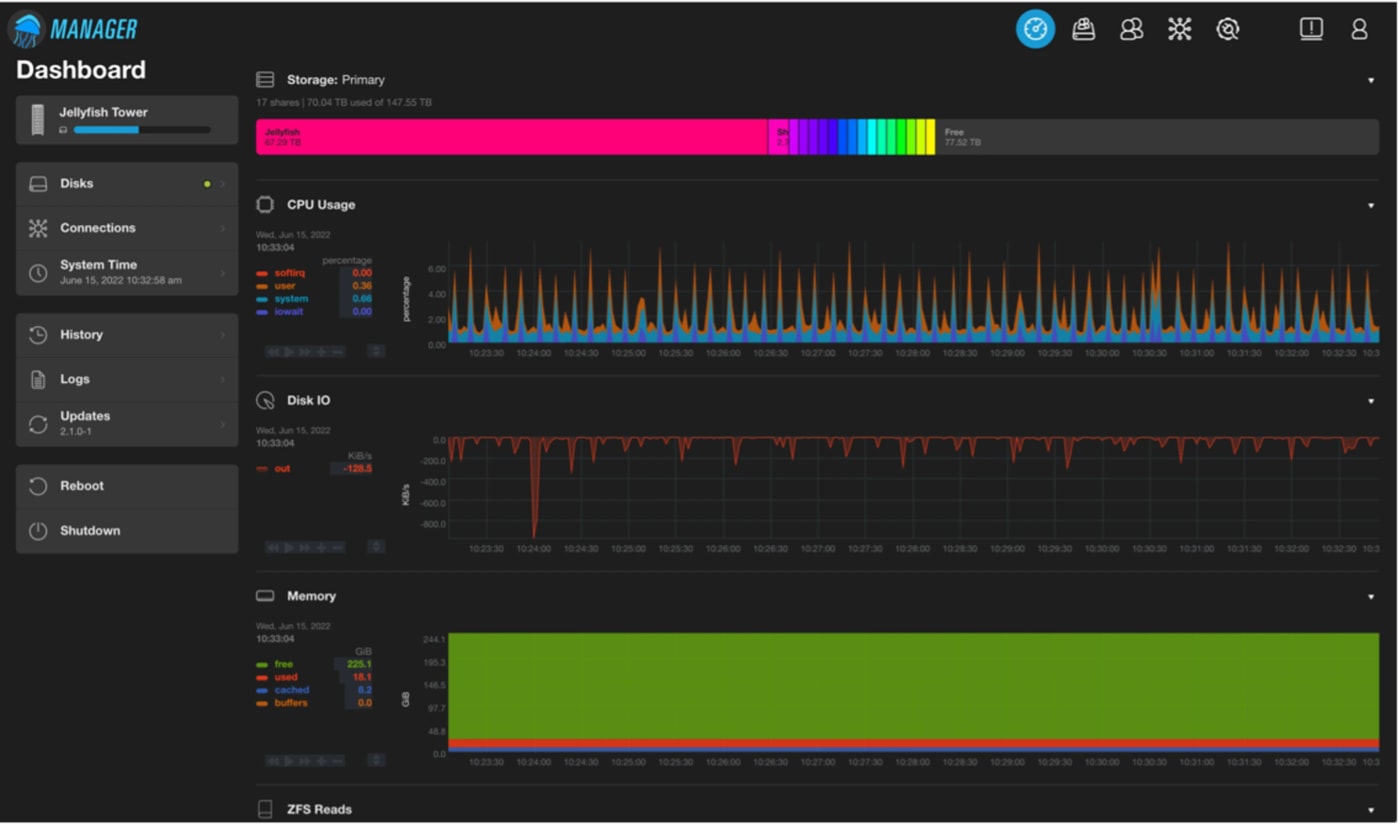
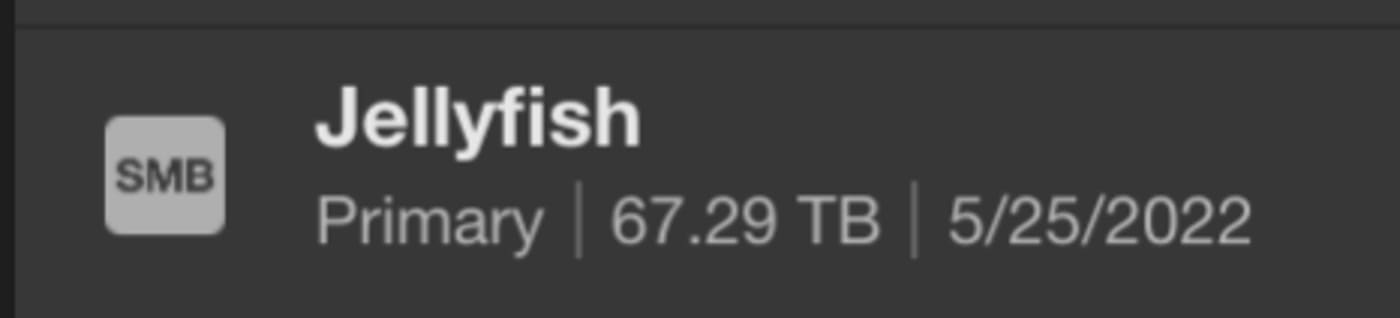
- Along the left side of the Dashboard screen, you will find a menu list. The first clickable item is the name of your OWC Jellyfish. In this specific instance, ours is named OWC Jellyfish Tower.
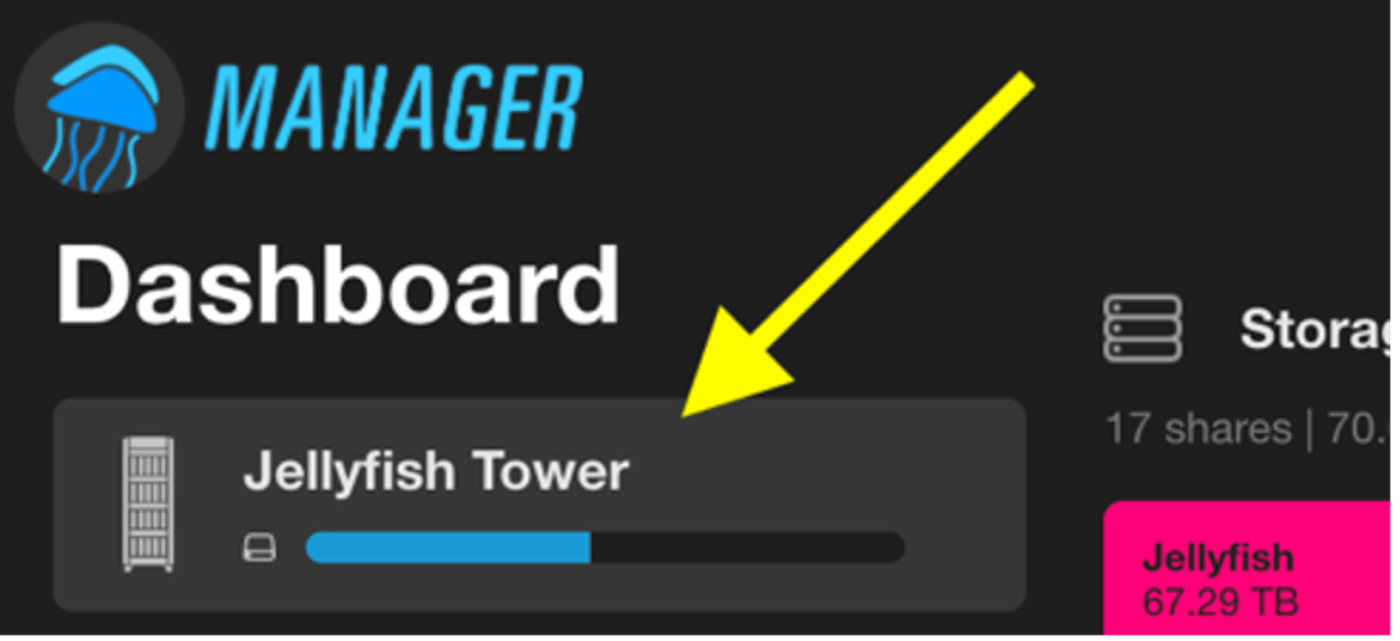
- Hovering your mouse over your OWC Jellyfish’s name as listed here will show the amount of storage already in use, and the total capacity of your OWC Jellyfish.
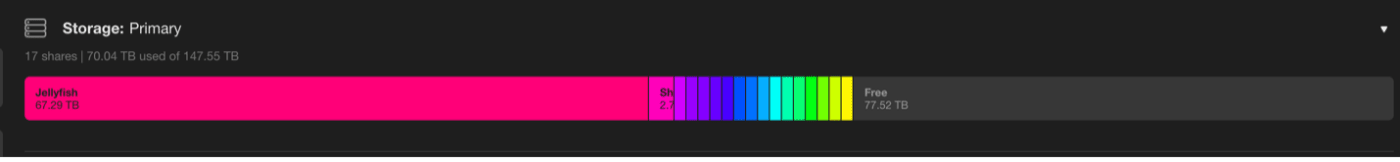
Storage
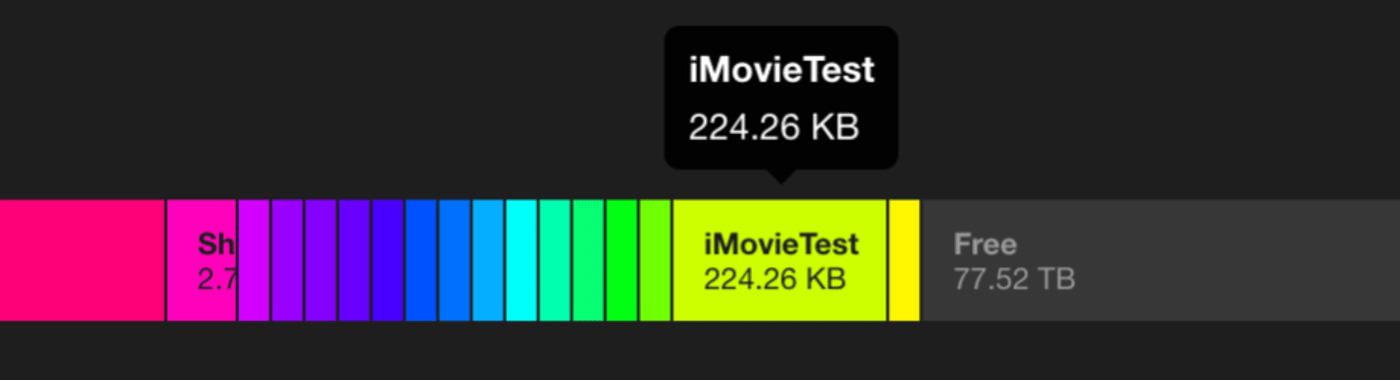
- This is a proportional representation of your individual shares and how much space they take up on your OWC Jellyfish’s total storage capacity. If you hover over any one of the colored boxes here, you’ll see the name of the share and its size. On the right after all the shares, you will see the amount of free space left.
Dashboard Live Chart Overview
1. The remaining displays beneath Storage on this page are all real-time indicators that read like a moving graph. All are briefly explained below, but let’s look quickly at a useful toolbar that is common to all of them.
2. You can use these moving charts as a slider to check on status at any point in your day, present or past. The numbers at the bottom of the graph are timestamps. If you click on a point in the timeline and drag it around, you’ll see the data available in the past. If you drag it into the future, you’ll see there is no data yet. If you let it remain in the present, you’ll notice it continuing to move forward slowly.
3. You’ll notice a grey control box like the controls on a DVD player remote. The double arrow facing left takes your status view back in time. The single right-facing arrow returns it to the present, where it will continue to move in real time. The double arrow facing to the right is to move forward in smaller increments, not necessarily all the way to the present. The plus and minus signs allow you to zoom in or out of the time frame, giving you access to the most precise data down to the second. Lastly, you’ll see a stacked double arrow, one facing up and one facing down. This allows you to stretch the current chart or shrink it to any size you prefer for your view.
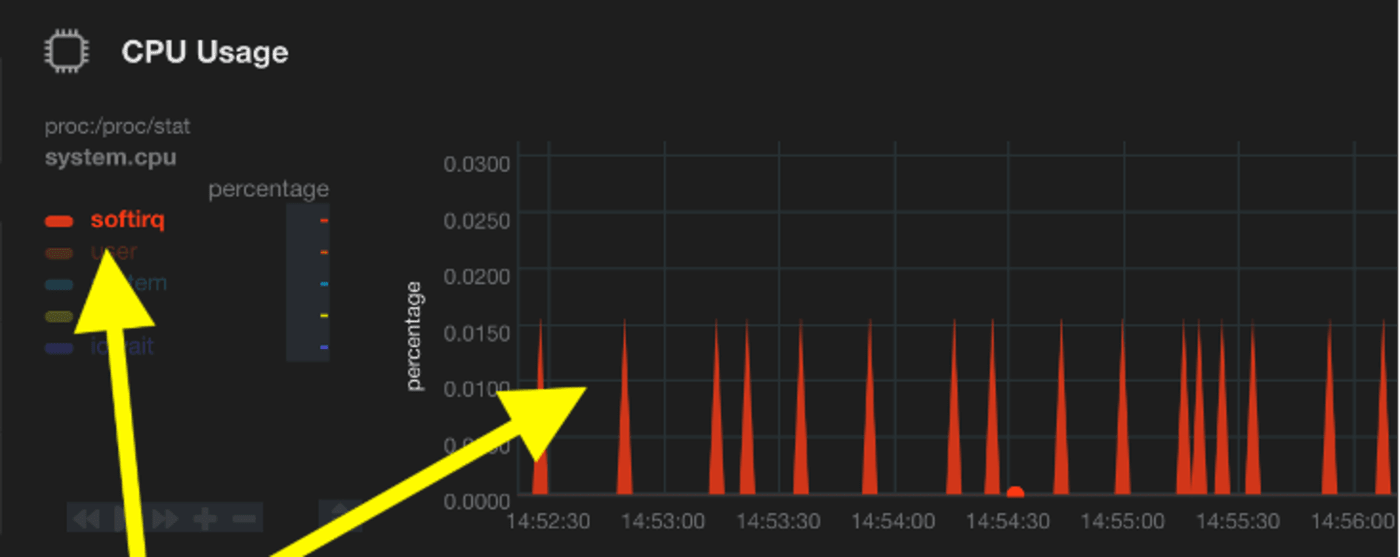
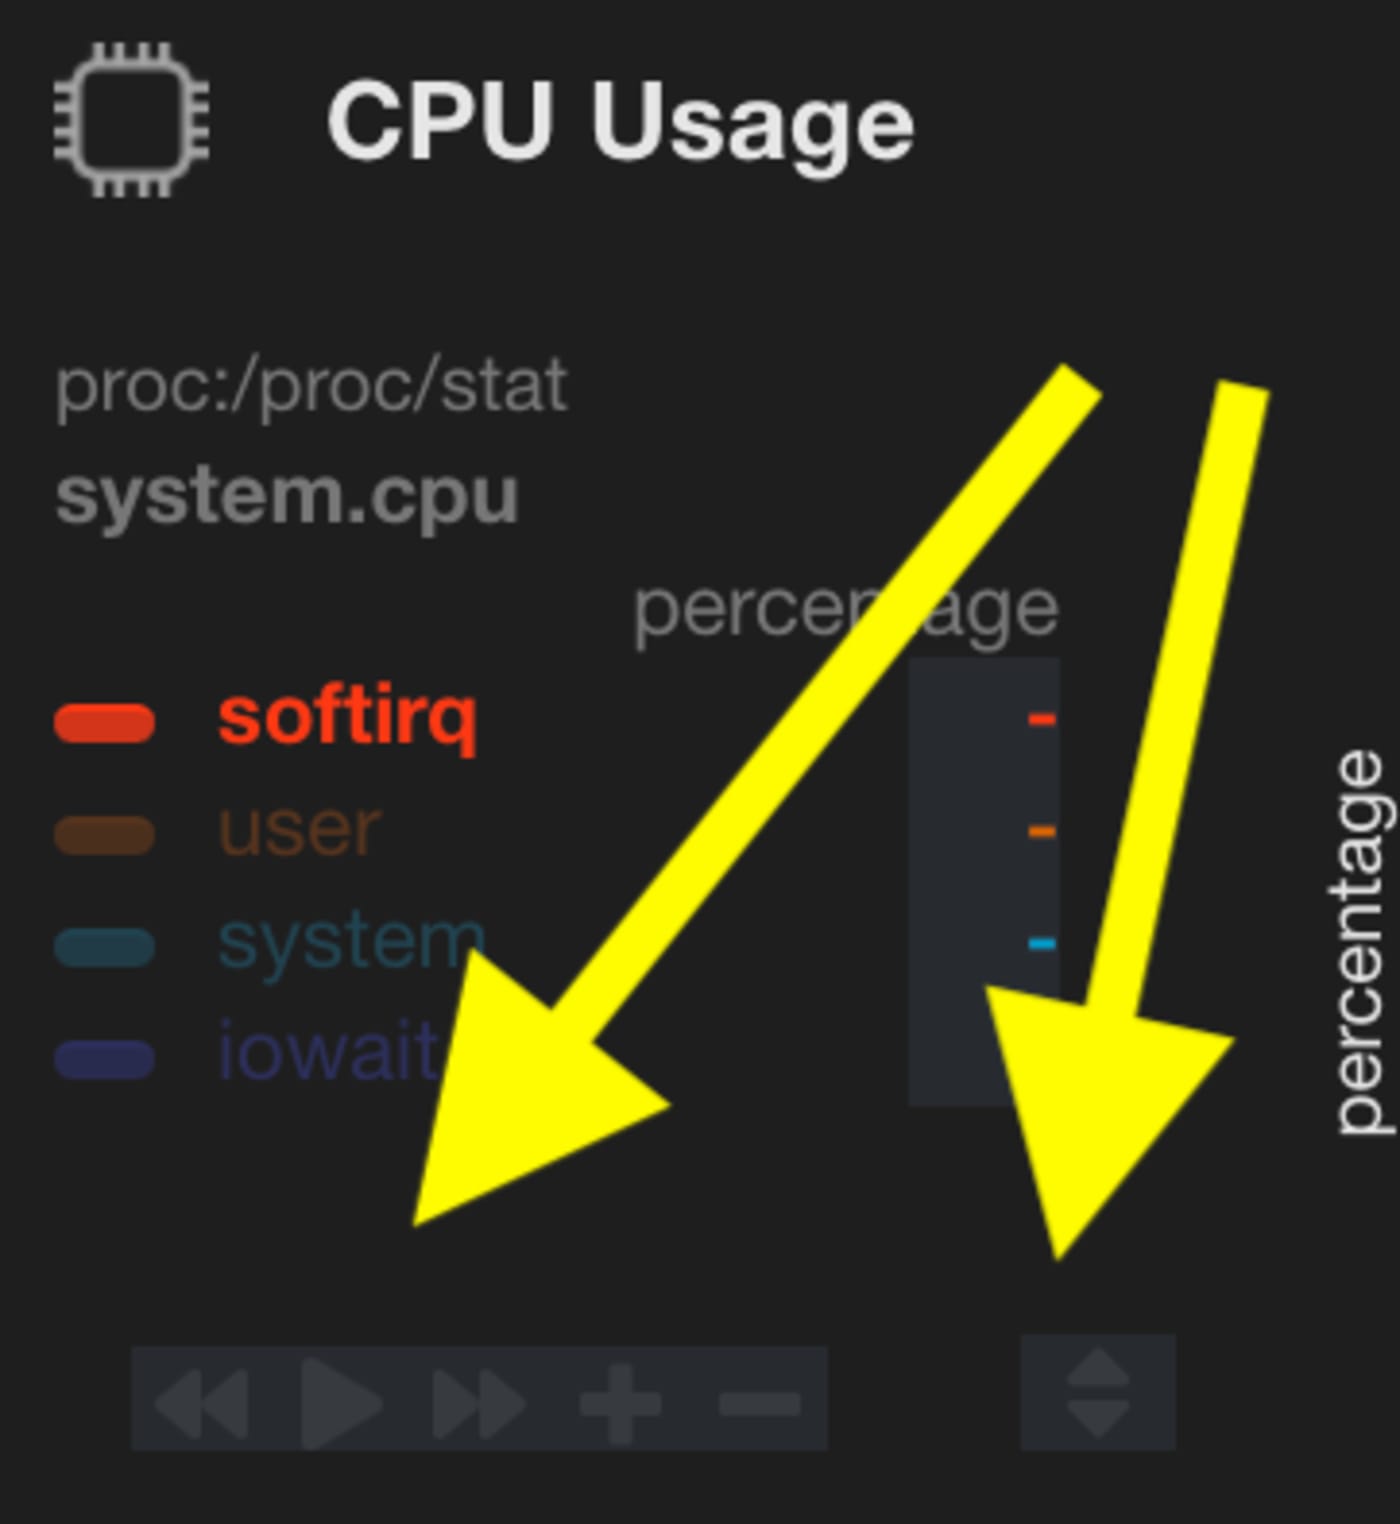
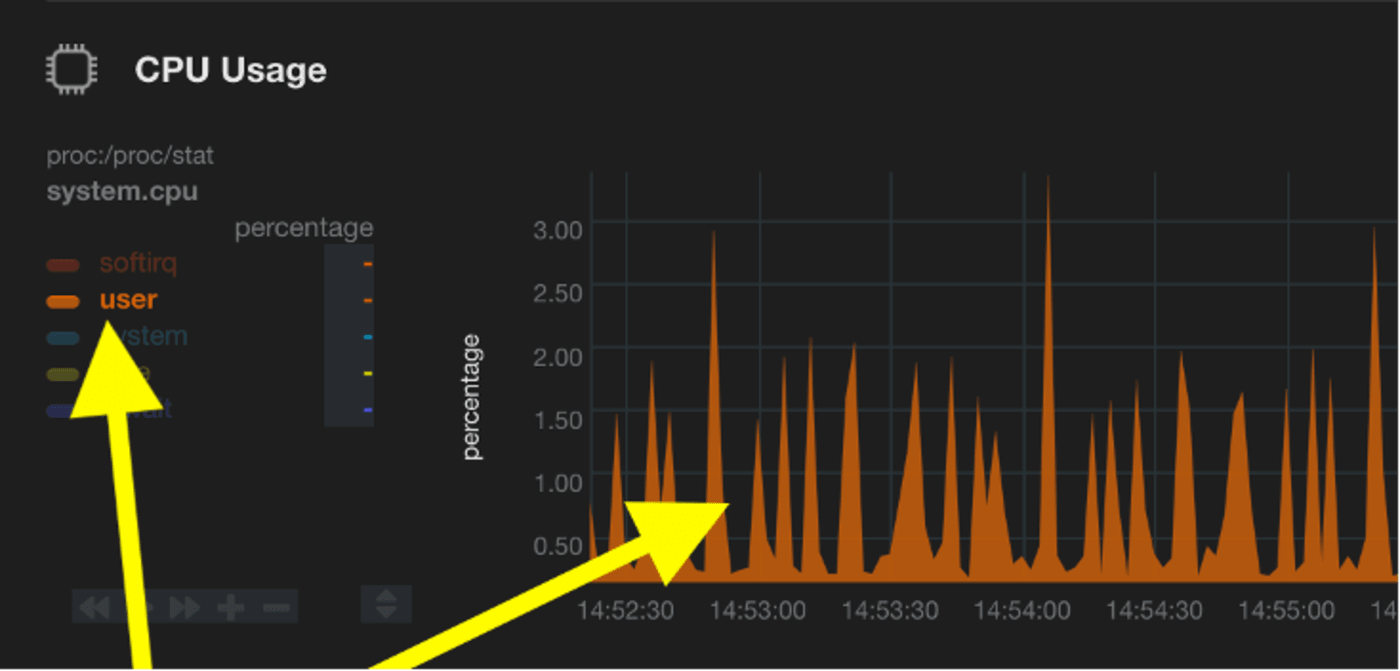
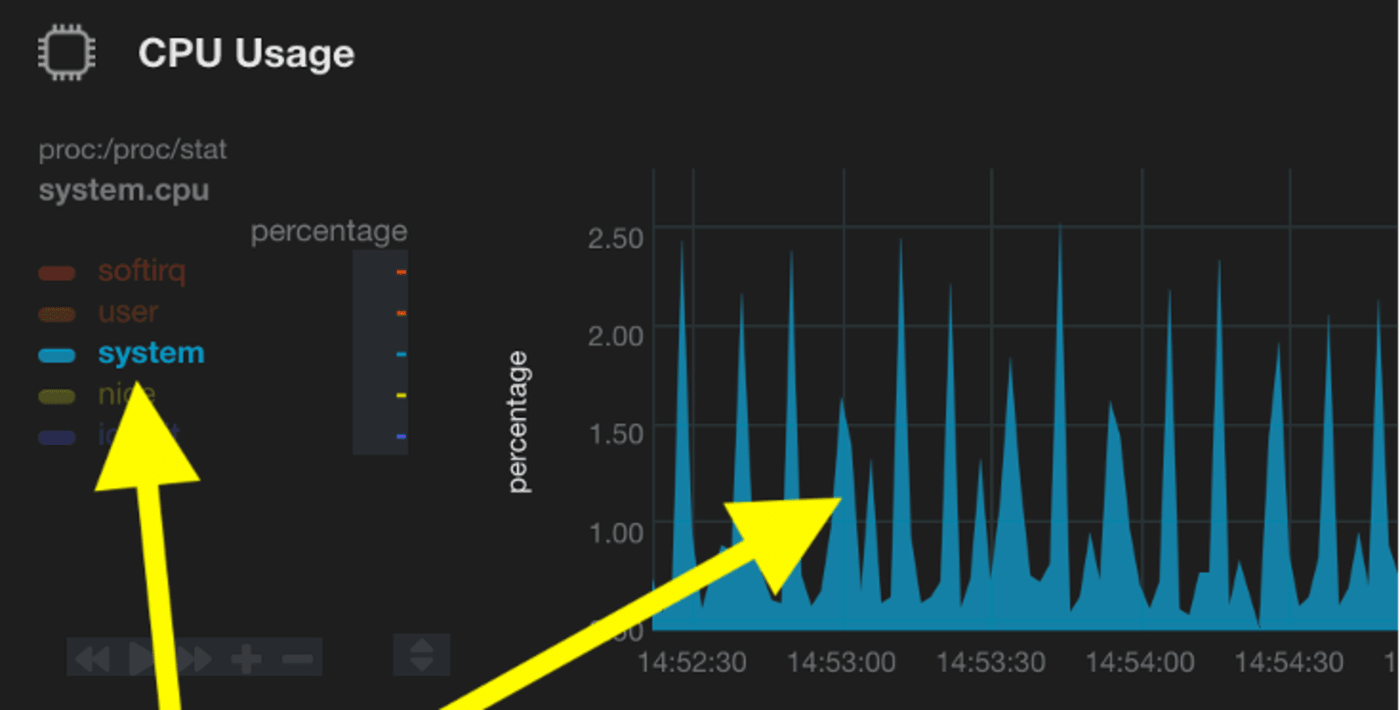
4. Some of the charts have multiple data sets in them. If you click the colored words in the key on the left side of them, you’ll see the charts change into only the selected data.
5. As with the Storage section outlined earlier, you’ll see the little white arrow in the top right corner of every section that allows you to collapse or expand each chart as you wish. The moving charts are detailed below.
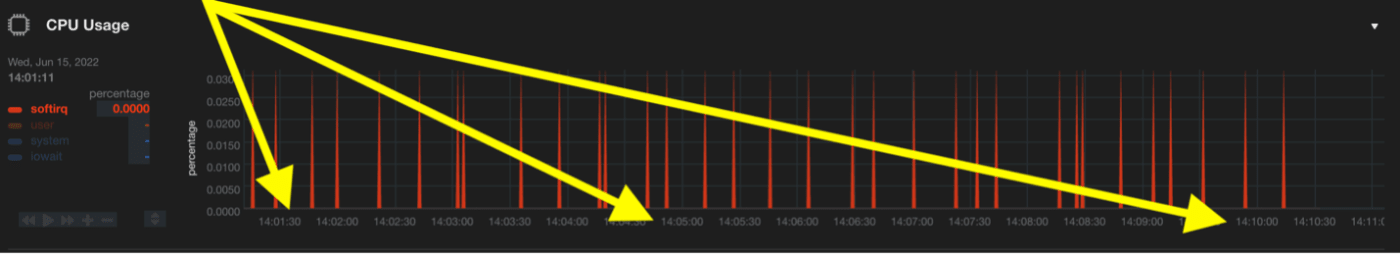
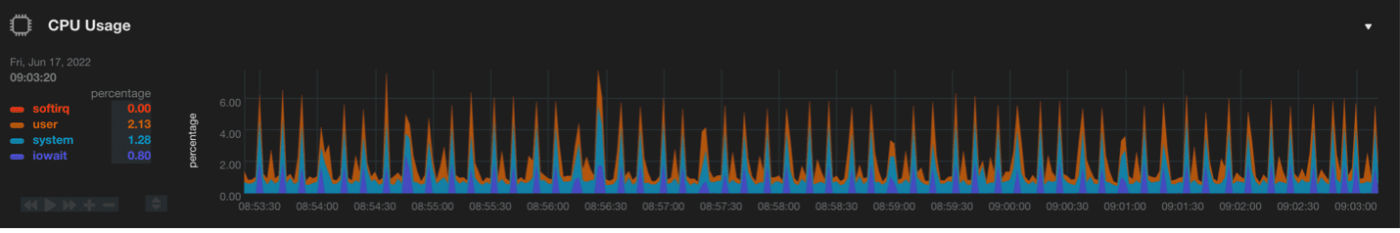
Dashboard: CPU Usage
- Indicates how much of the processing power of your OWC Jellyfish is currently being utilized. Various processes utilize CPU and typically this value will be changing constantly.
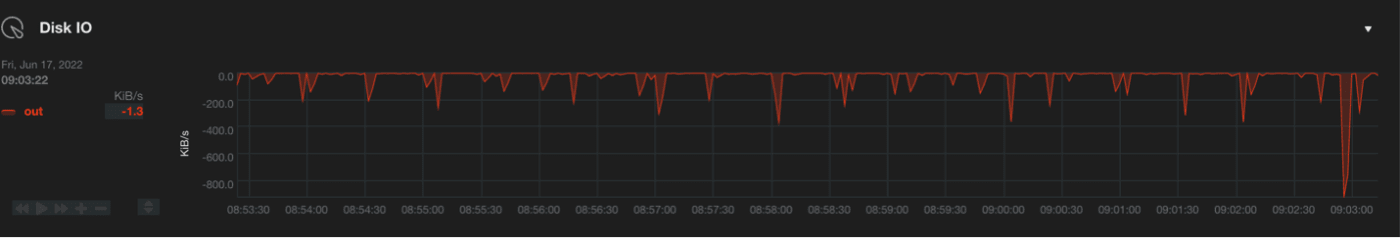
Dashboard: Disk iO
- Usage indicates how heavily your OWC Jellyfish’s drives are being utilized. This typically indicates the current functional performance of the drives.
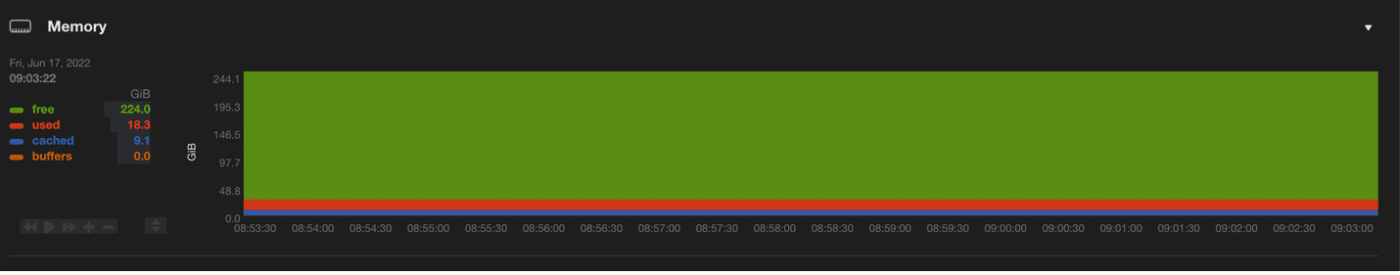
Dashboard: Memory
- Usage indicates the amount of RAM that is in use out of the total available. This chart is useful to see how effective the OWC Jellyfish’s RAM caching is performing.
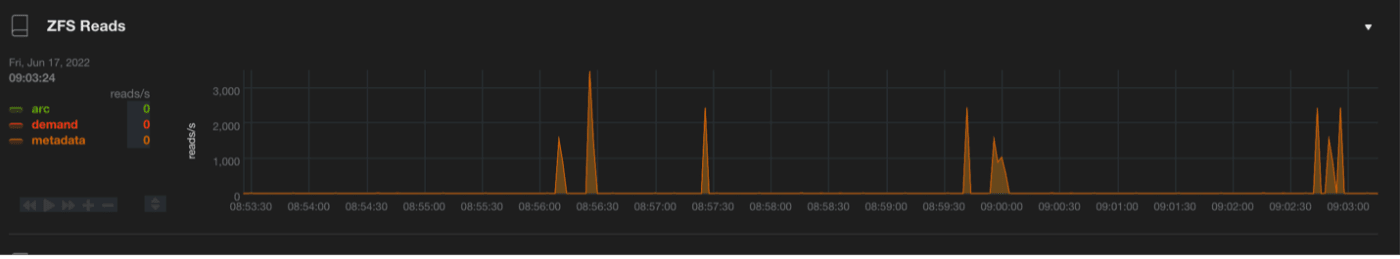
Dashboard: ZFS Reads
- Indicates the amount of read requests hitting your OWC Jellyfish’s shared storage.
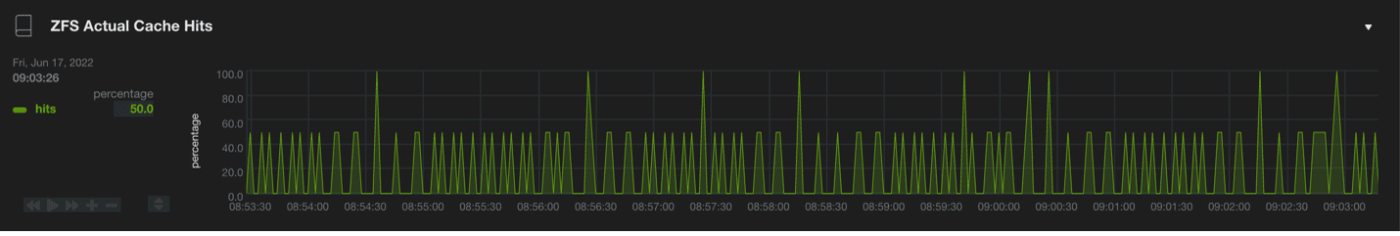
Dashboard: ZFS Actual Cache Hits
- Indicates the percentage of successful read requests that are able to find what they are looking for in the Cache. The inverse of this is Cache Misses, which are the percentage of read requests that need to go to the disk instead.
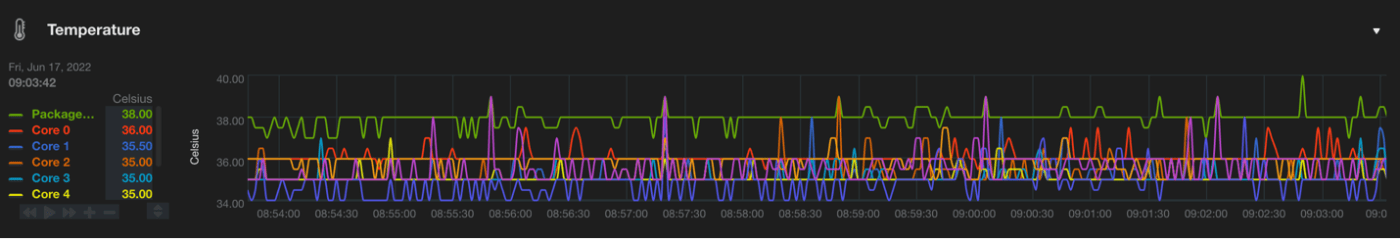
Dashboard: Temperatures
- Shown here are of the internal components of your OWC Jellyfish. Individual cores should not ever go above 85 degrees Celsius.
Dashboard: Disks
- In this menu, you can check the health of the disks on your OWC Jellyfish. You’ll see the System menu in the left-hand column under the Disks menu. To the right of the System box, you will see an array of small icons standing for the HDDs (hard disk drives) that are in your Jellyfish system. There are different models of OWC Jellyfish systems; the OWC Jellyfish Tower used in this example has 20.
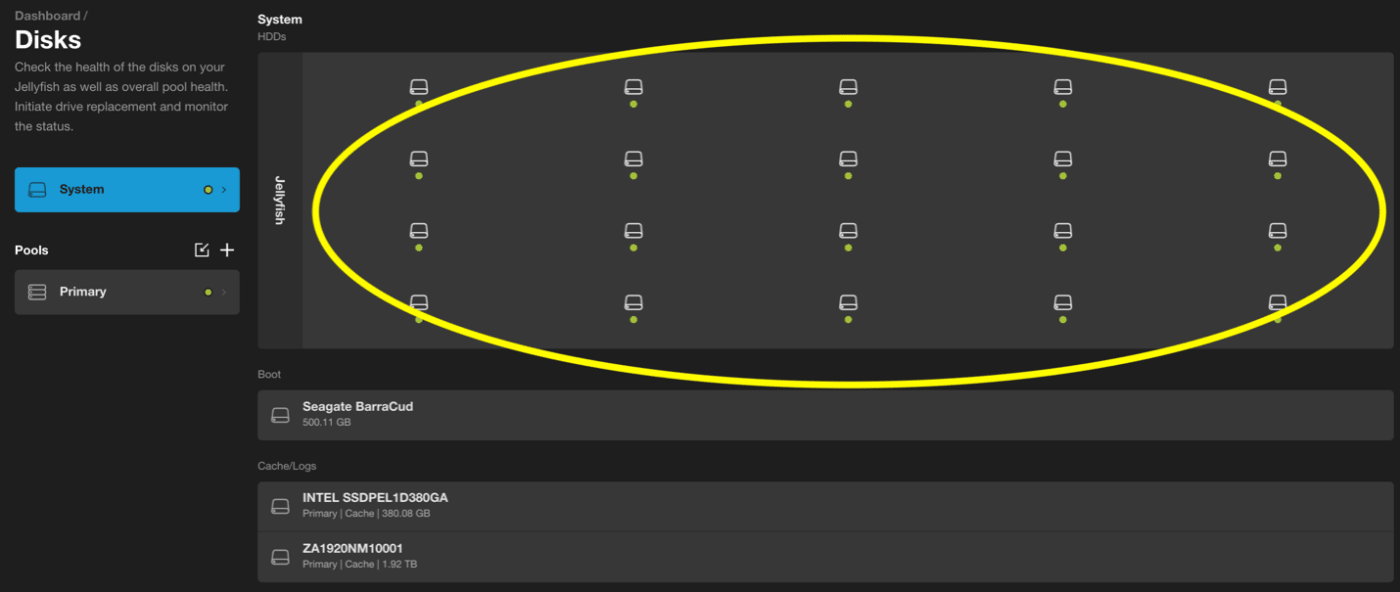
- You’ll notice a green dot below each of these drives, which indicates that the drive is functioning perfectly. If that indicator is yellow, there is a disk error. If it is red, the disk has failed. If it is ever a color other than green, you should contact our support team immediately.
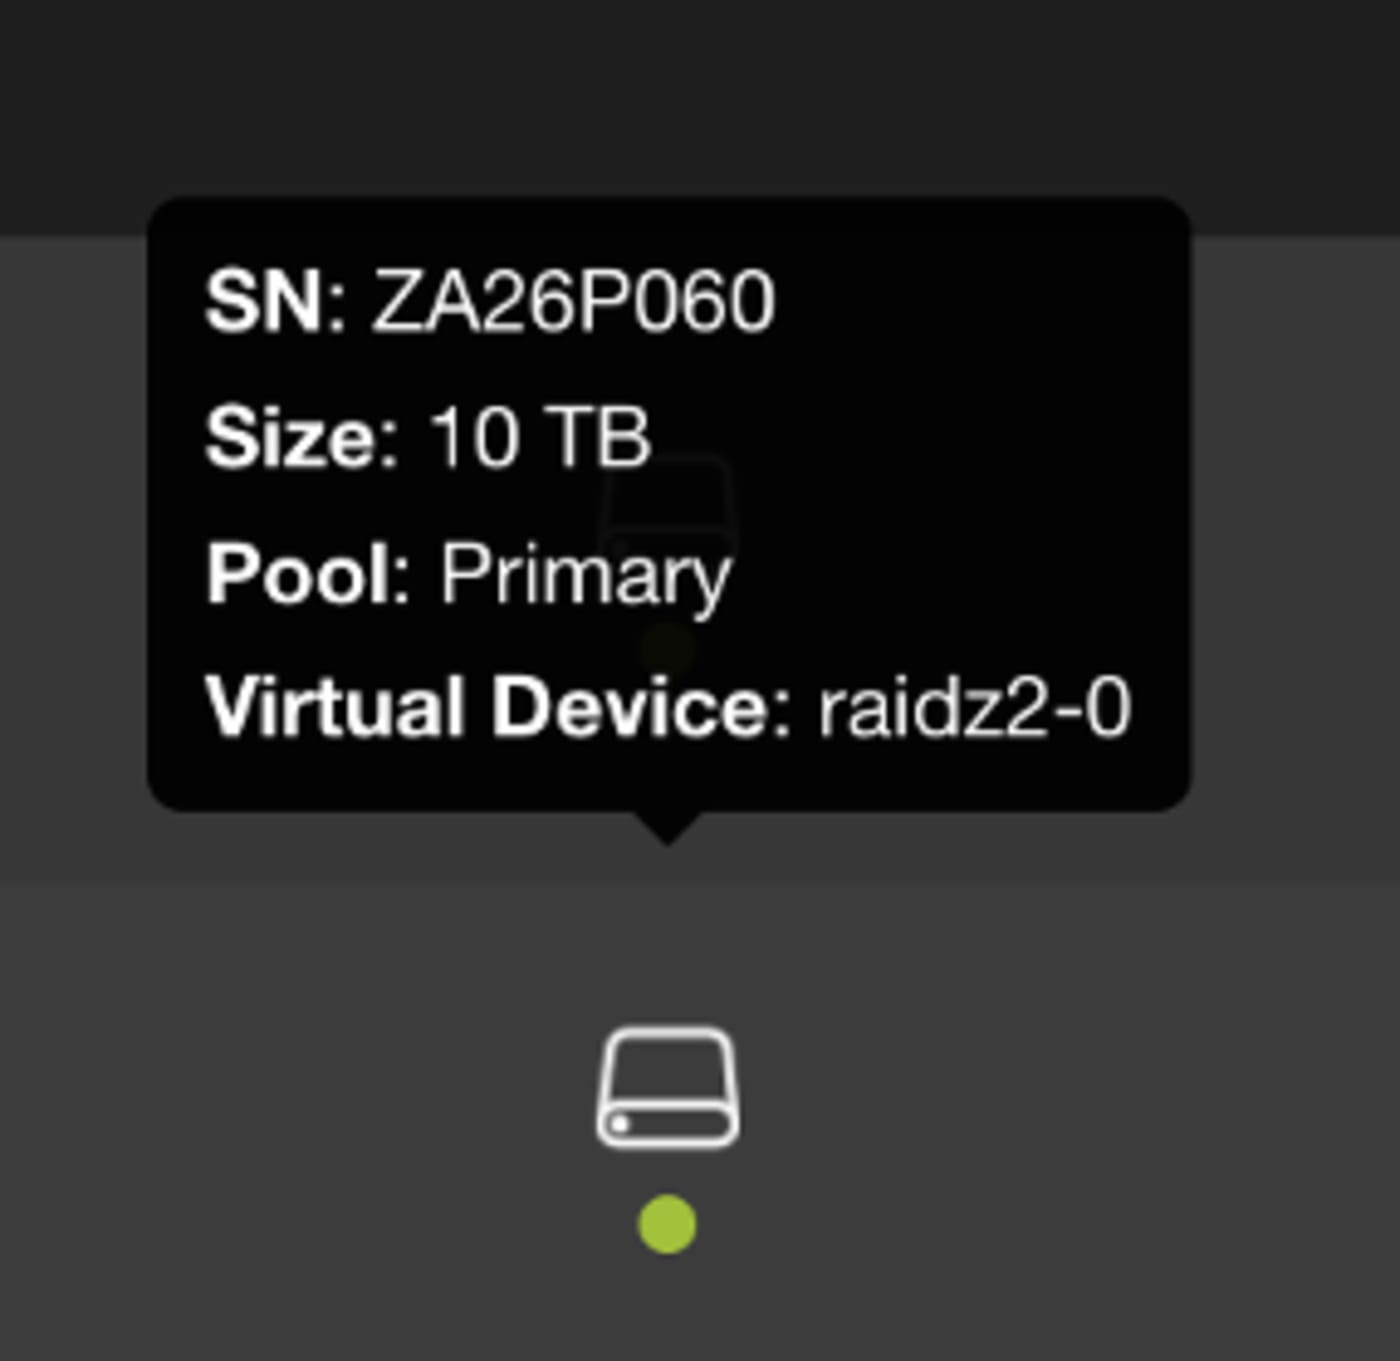
NOTE: If you should need to replace a drive, be sure that it is a Jellyfish certified drive. Replacing with a drive that is not certified for a Jellyfish will void your warranty. - Hovering your mouse over any one of the drives will display the following information: SN (serial number), Size, Pool, and Virtual Device. If replacing or repairing a drive, knowing the serial number of the failed/failing drive will be necessary for you to match it up with the physical disk.
Dashboard: Connections
- Clicking on Connections under the Dashboard menu on the left will reveal a real time look at the users who are connected to the OWC Jellyfish, and what shares they are currently mounted to.
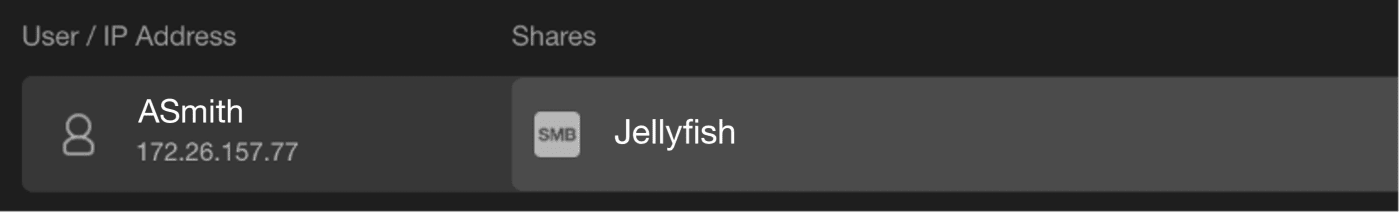
- In the above example, we see user Nina is connected to the SMB OWC Jellyfish share. A connected user’s IP Address will be listed below their username.
- When you click on a user’s name, you will see a list of options that you can change if you are an administrator. You can give or revoke Admin permissions, access to OWC Jellyfish Media Engine, and toggle on the option to force the user to change their password for stronger security purposes. You can also manually change their password.
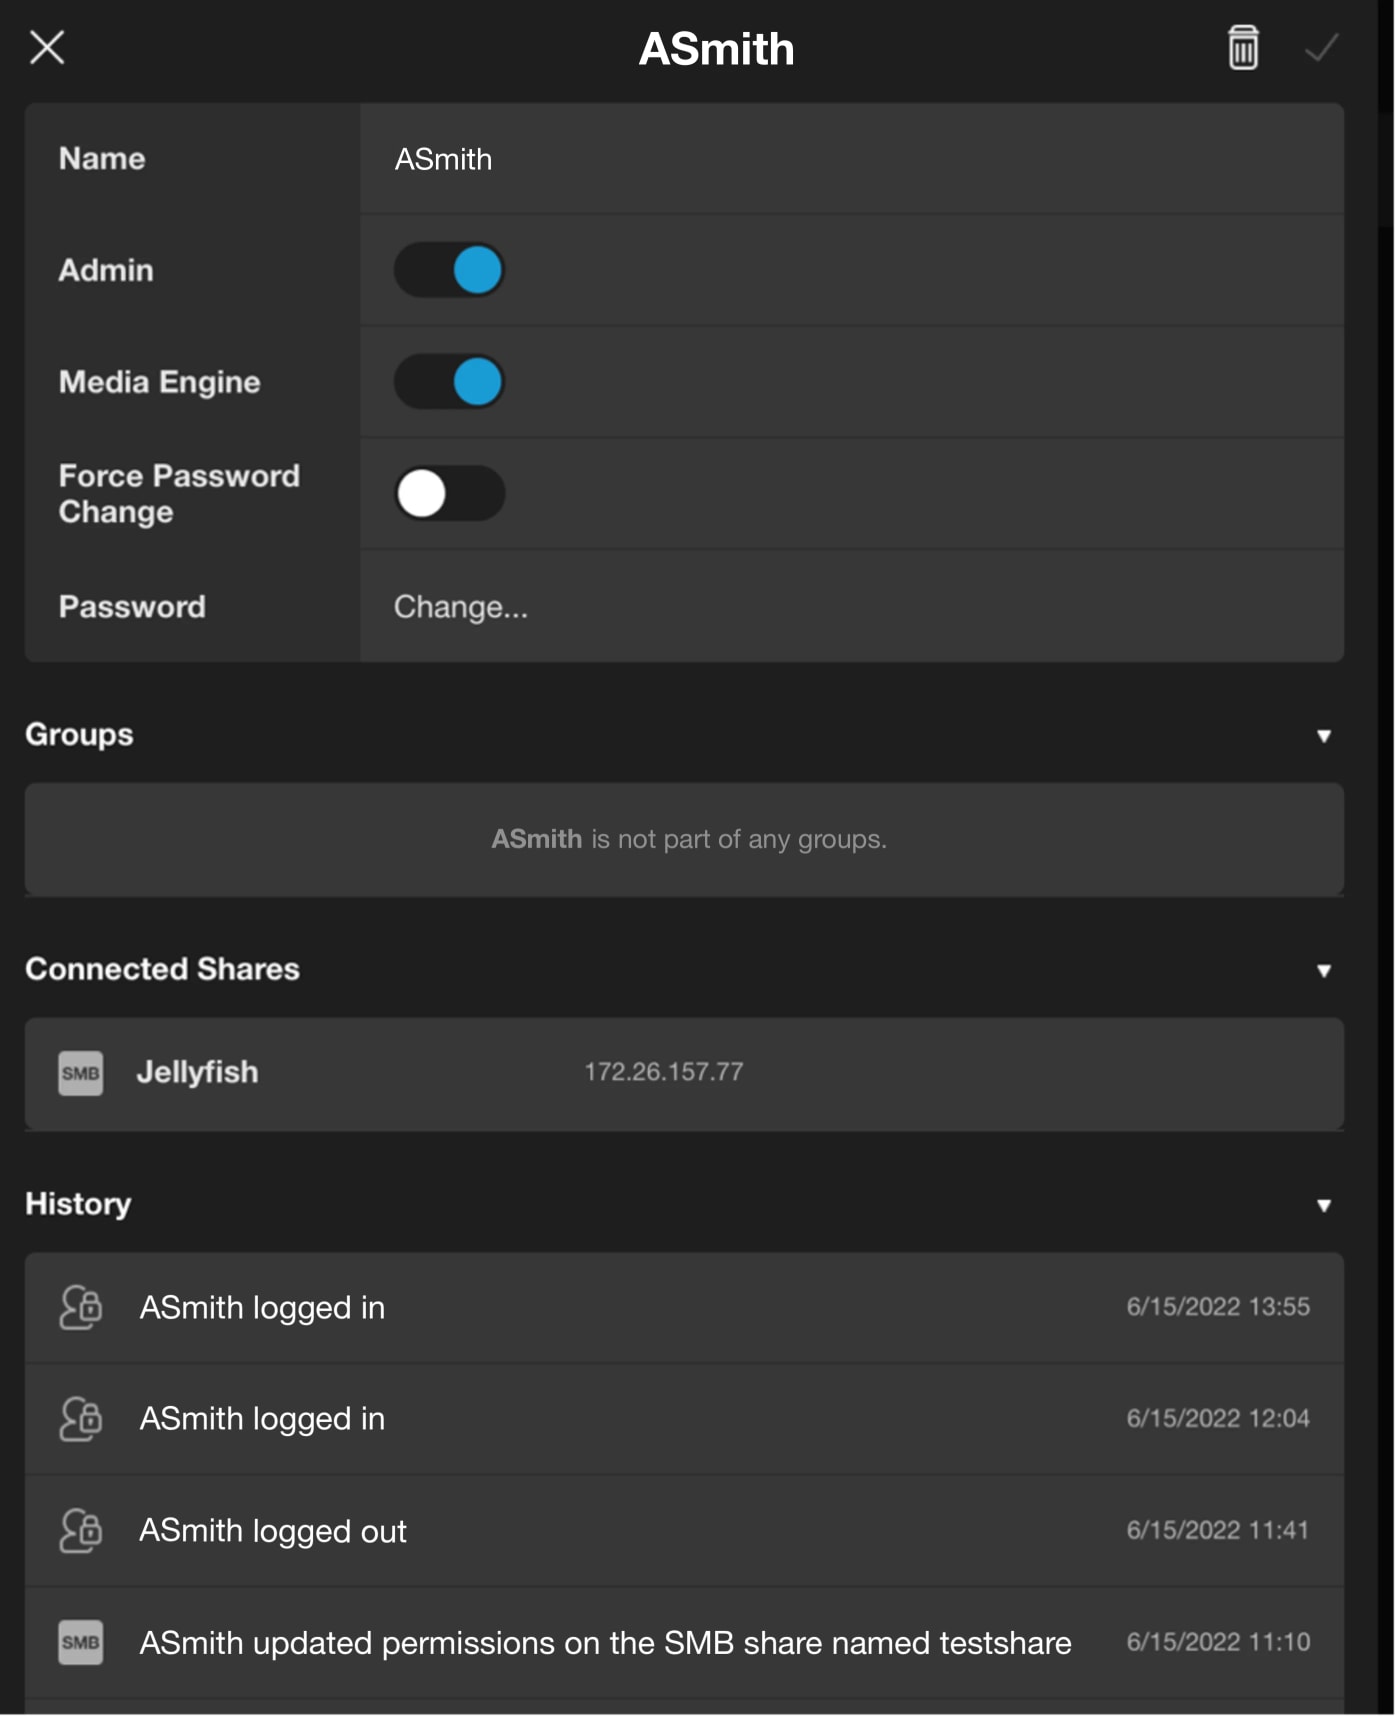
- You will also have access to a list of and groups the selected user belongs to, as well as a list of their recent activity history on the OWC Jellyfish. This includes logins and logouts, changes, name and password changes, and more.
- If you should make any changes to a user’s account via this window, you’ll see the icons at the top right: trash can to discard changes, and a checkmark to save them.
Dashboard: System Time
- Clicking on System Time gives you the option to ensure your OWC Jellyfish is set to your local time zone. This is needed to get exact timestamps for your files.
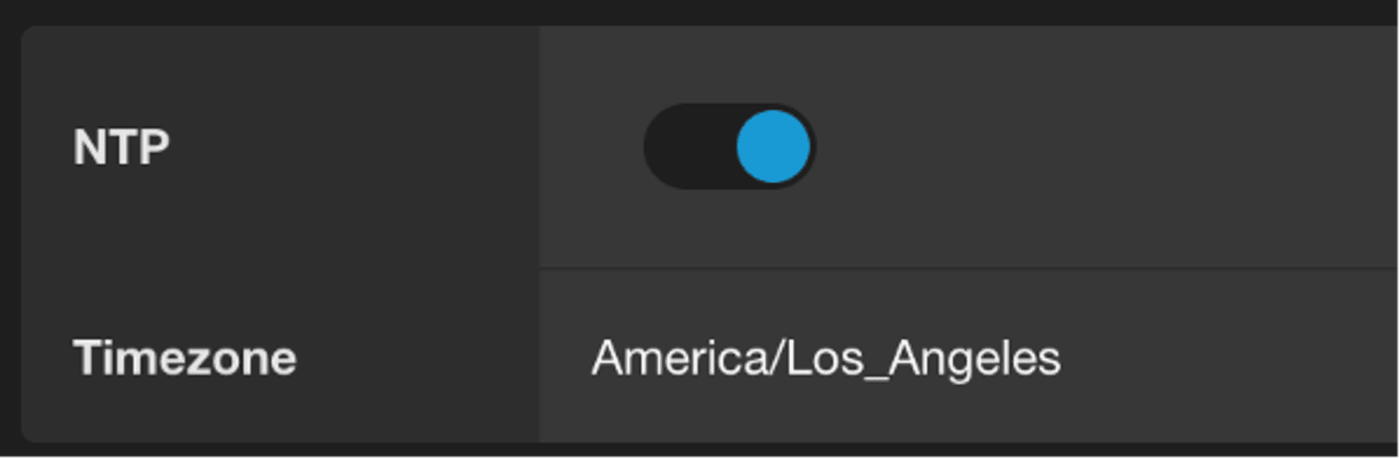
- You can choose to set the time manually, but it is recommended to have NTP (Network Time Protocol) toggled on as shown above. This sets your time automatically for you.
- You have the option to change your time zone very specifically by location here if it does not automatically populate it for you.
Dashboard: History
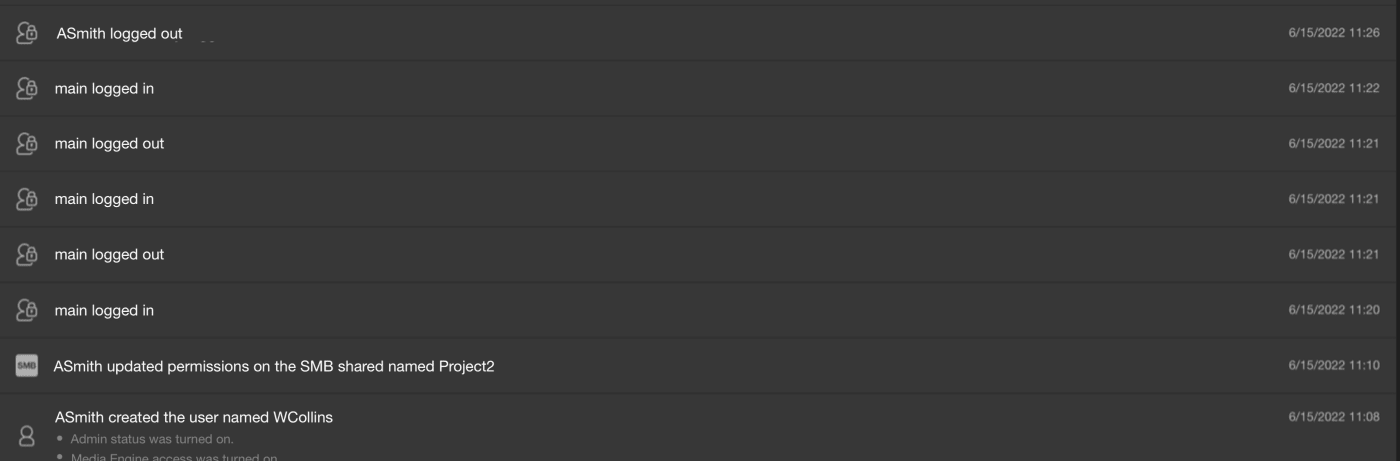
As an administrator, your History menu gives you a comprehensive look at the actions of every user on the system. This includes any logins, logouts, and settings changed. On the far right of each user’s action on the list, you will find a timestamp with the date and exact time.
Dashboard: Logs
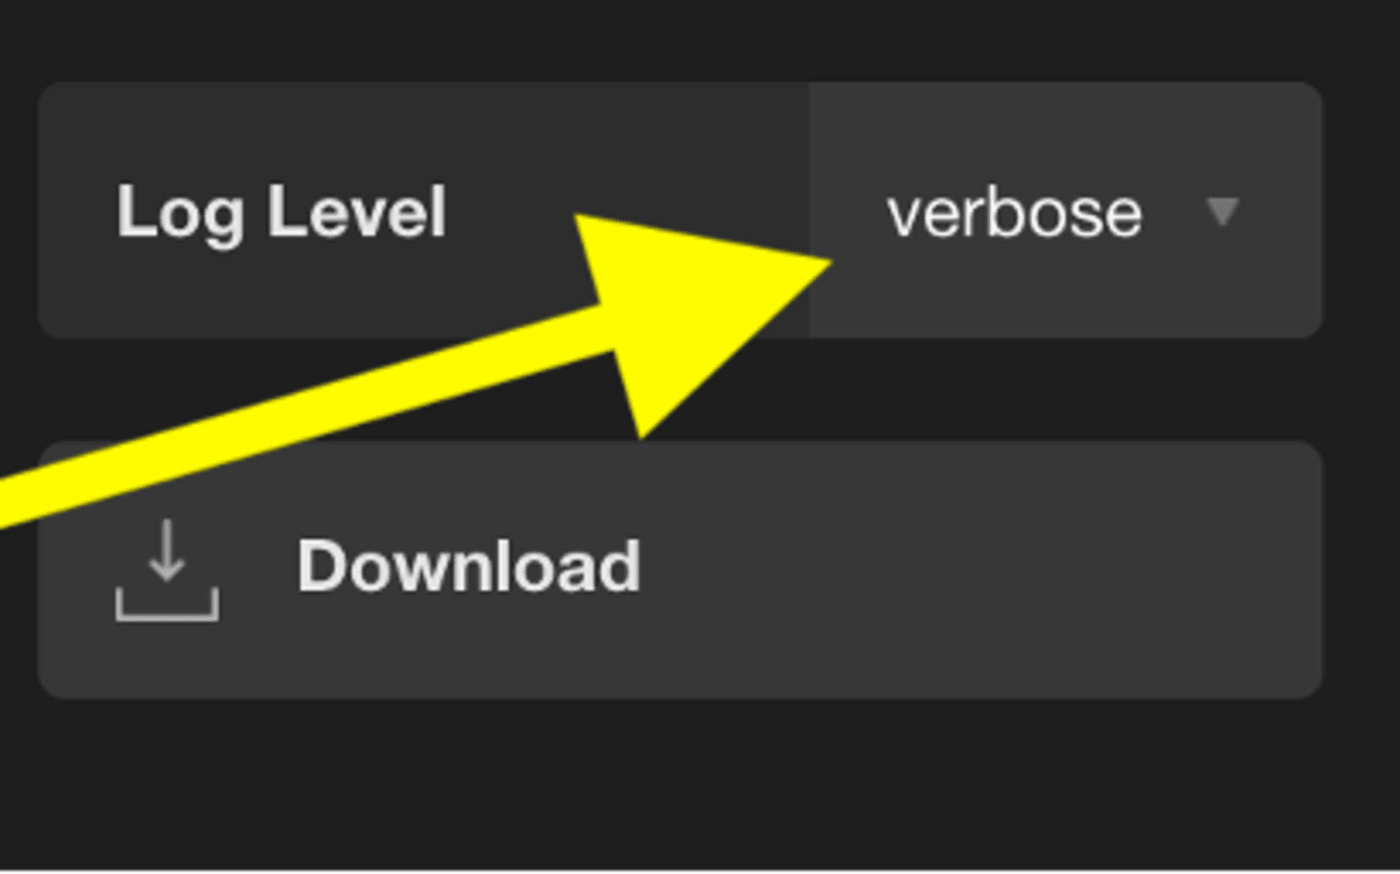
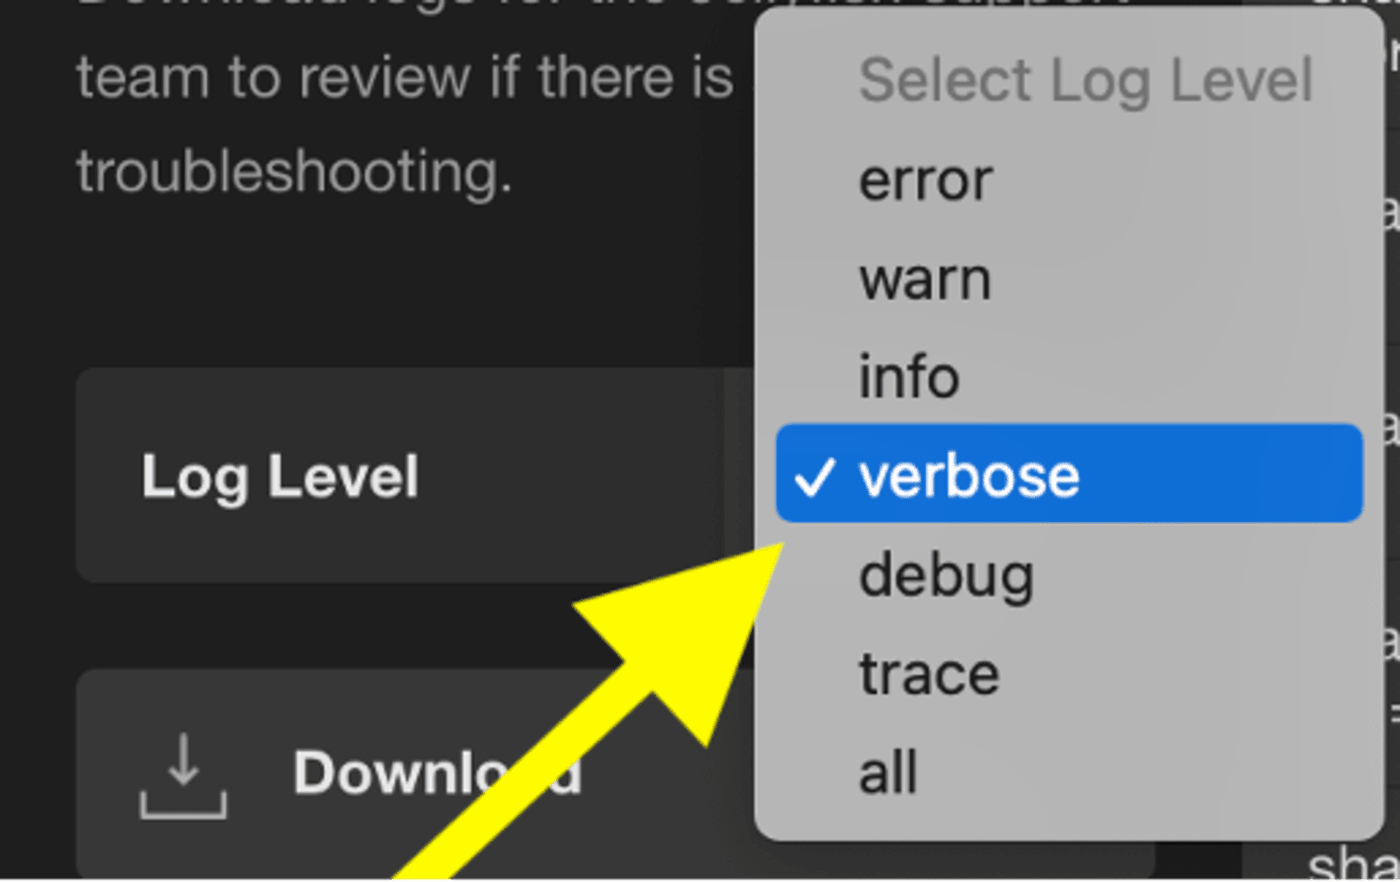
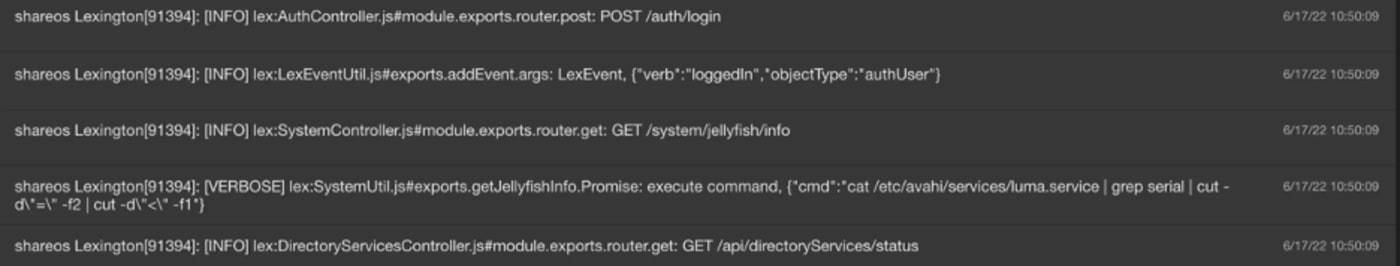
- The Logs menu allows you to view and download logs for the Jellyfish support team to review if there is a need for troubleshooting. You can download the logs for export for yourself or for the support team, with different display options on the drop-down menu to the right of Log Level. The options are error, warn, info, verbose, debug, trace, or all.
- The logs are populated as a list, similar to user actions, with dates and timestamps on the far right of each line.
Dashboard: Updates
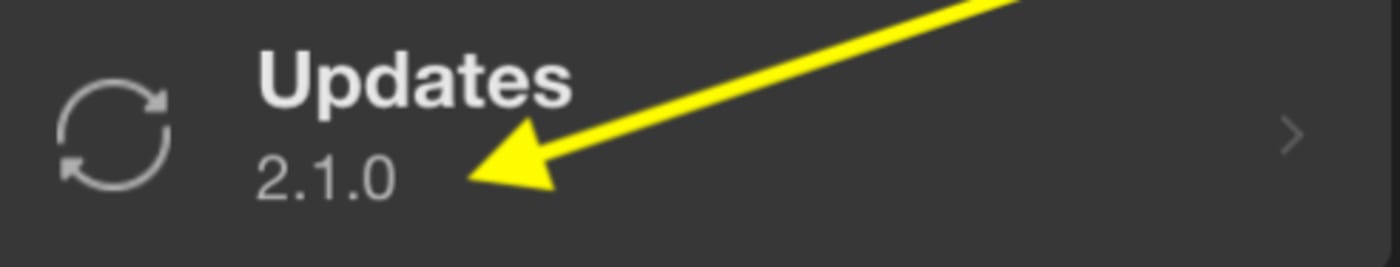
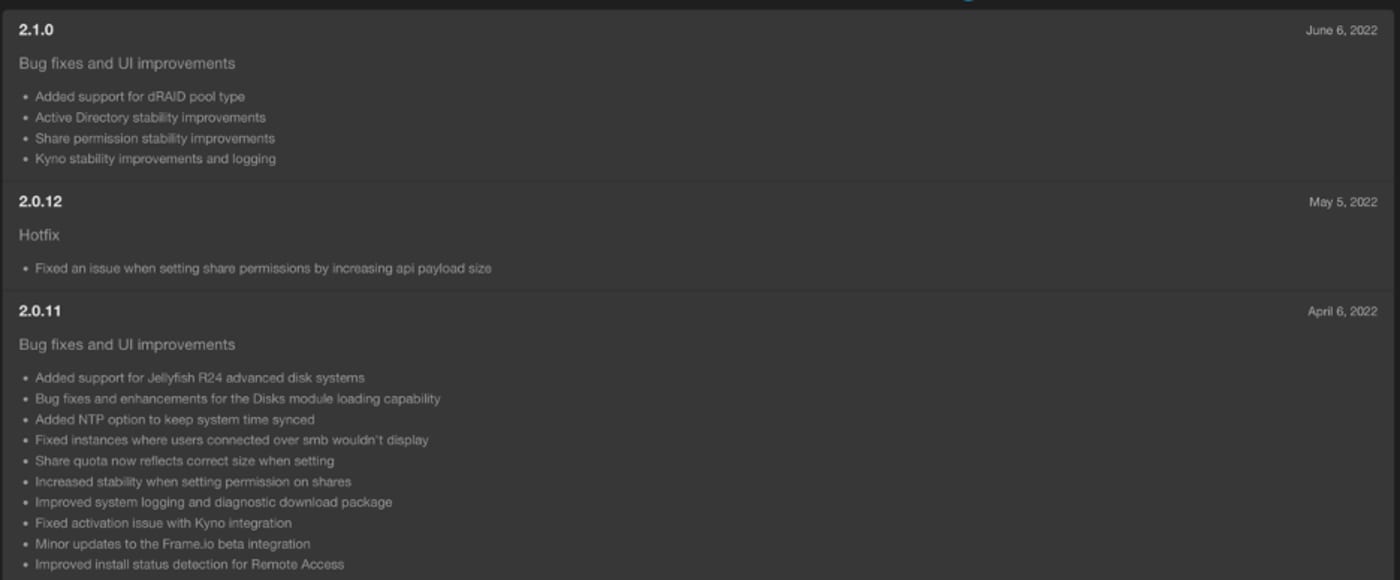
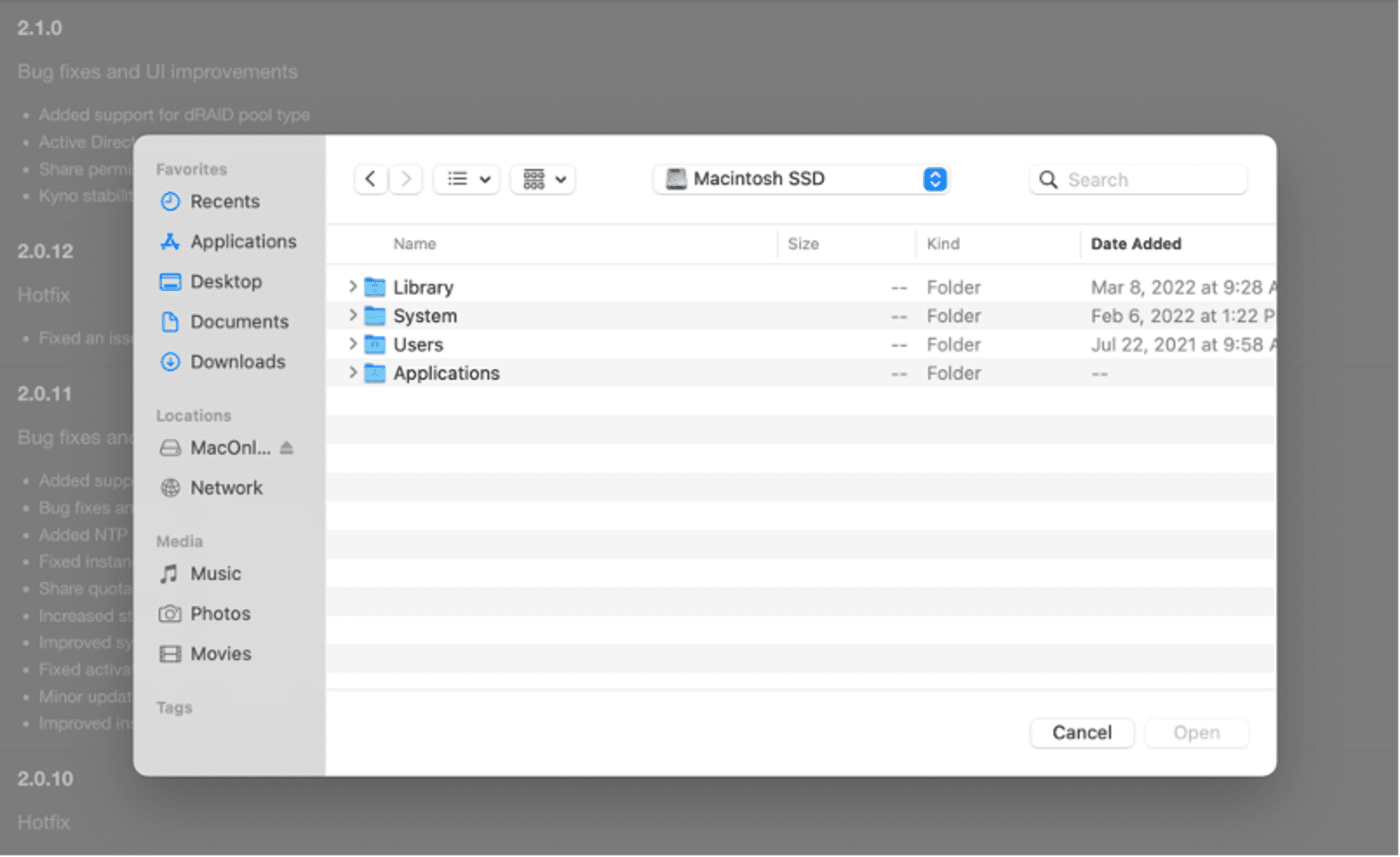
- The Updates tab tells you which version of OWC Jellyfish Manager you are currently running. When you click on the menu, it populates a list of recent updates, its release date, and a bullet point list of fixes each update provided.
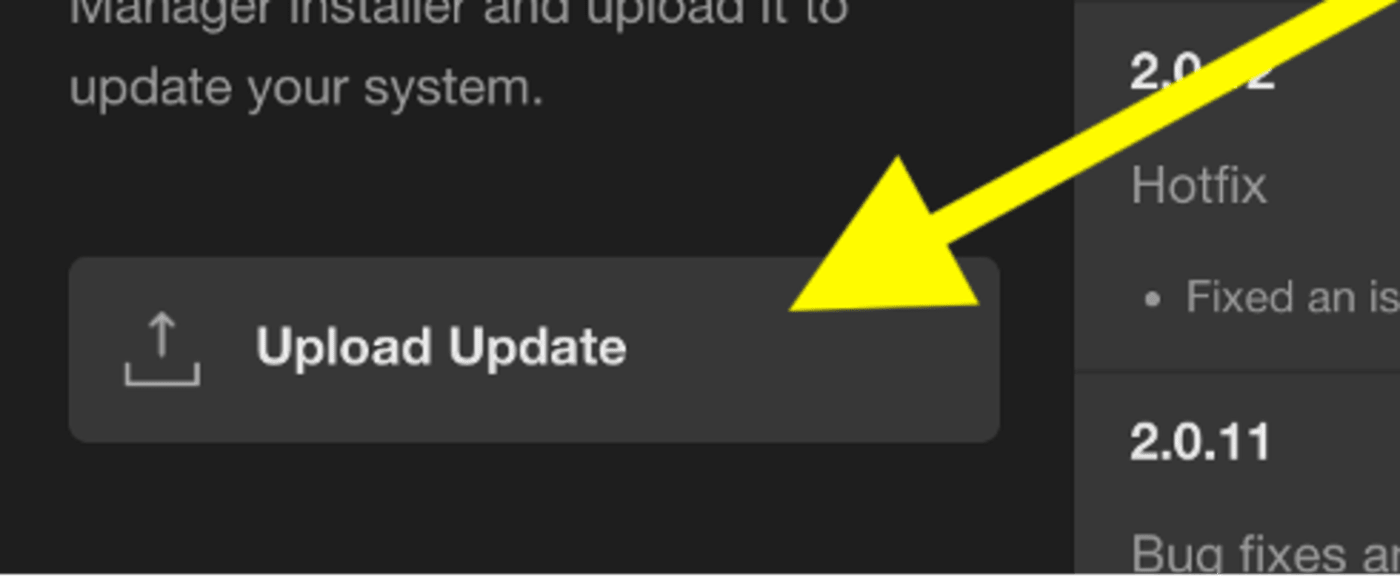
- Lastly, you will find the Upload Update button. Clicking this will open a dialogue box allowing you, after downloading it to your computer, to upload the latest OWC Jellyfish Manager installer to your system.
Dashboard: Reboot
- Clicking the Reboot menu bar prompts you immediately to reboot your OWC Jellyfish system.
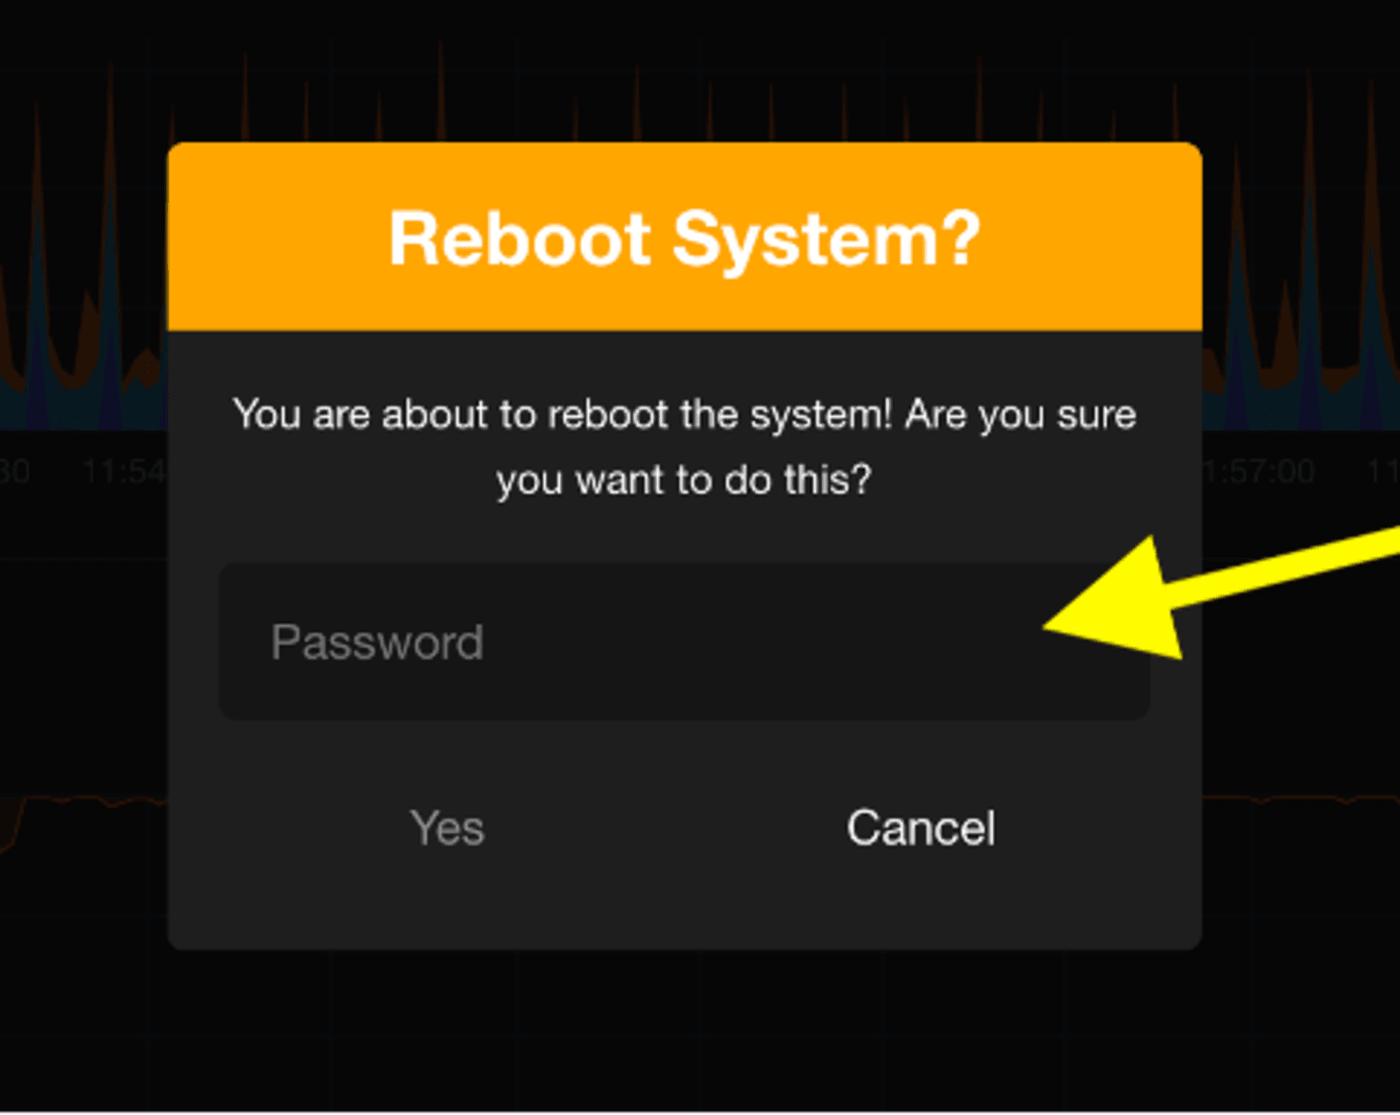
- To confirm you would like to reboot the system, you are prompted to enter your password, and click “Yes.” If you did this accidentally and don’t want to reboot, no worries! You can click “Cancel.”
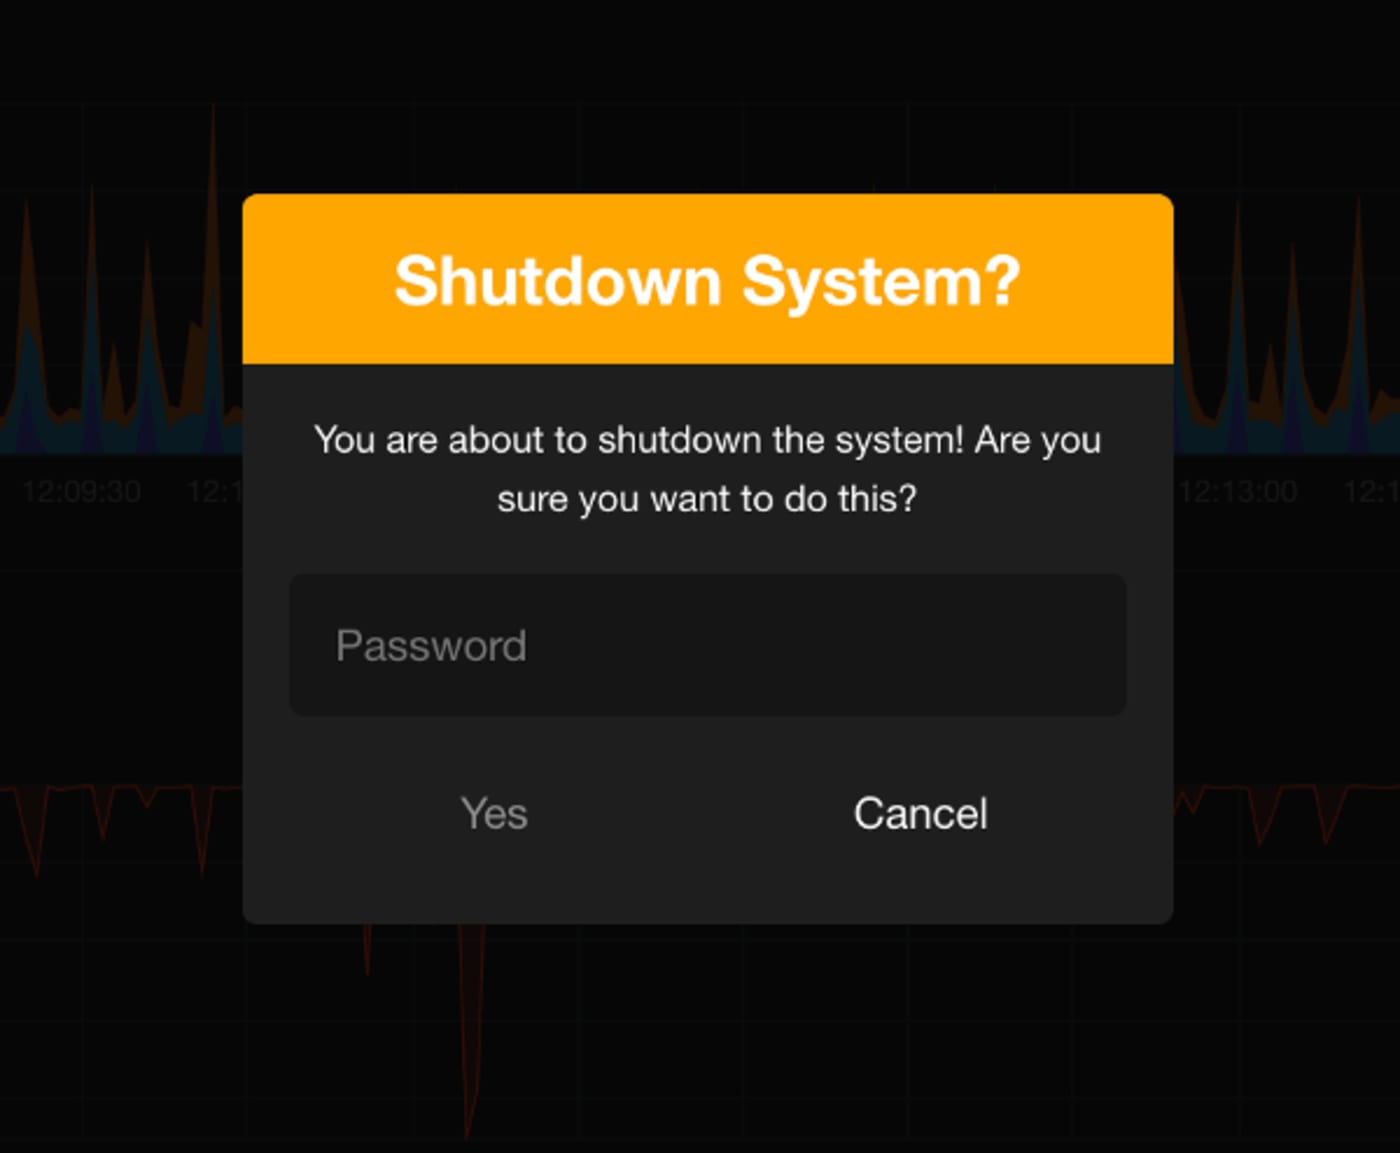
Dashboard: Shutdown
- Clicking the Shutdown menu bar prompts you immediately to shut down your OWC Jellyfish system.
- Just like the Reboot dialogue, you will be prompted for your password, and can click “Yes” to complete this action. Similarly, if it was accidental or you change your mind, you can click “Cancel.”
- That wraps up every part of the Dashboard tab and all of its menu items!
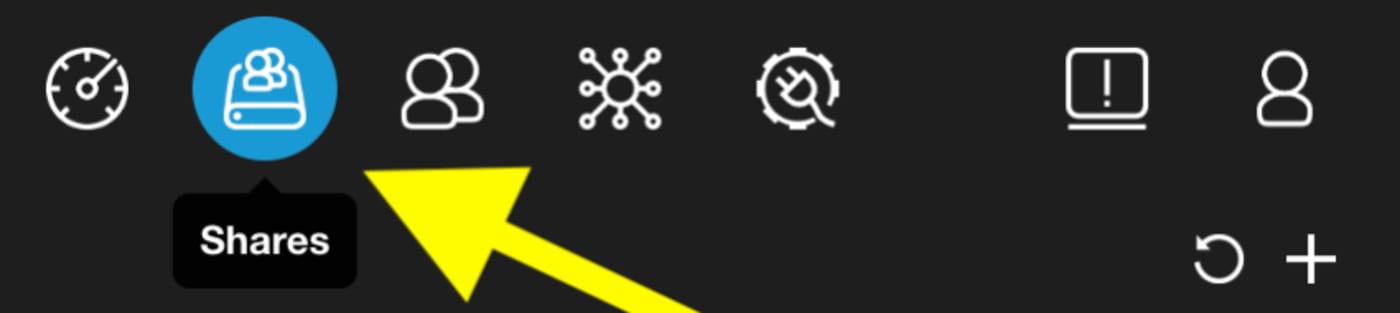
Shares
- The Shares tab gives you a list of all shares on your OWC Jellyfish. You’ll see two main columns of shares, SMB and NFS. Each of these two columns has its own familiar icons at the top right for easy access: a circular arrow to refresh the shares in that category, and a plus sign to create new shares (please reference user guide on how to create shares). Most users will be using SMB shares, NFS shares are for heavier workflows such as VFX. The FCPX button toggles FCPX compatibility for all SMB shares.
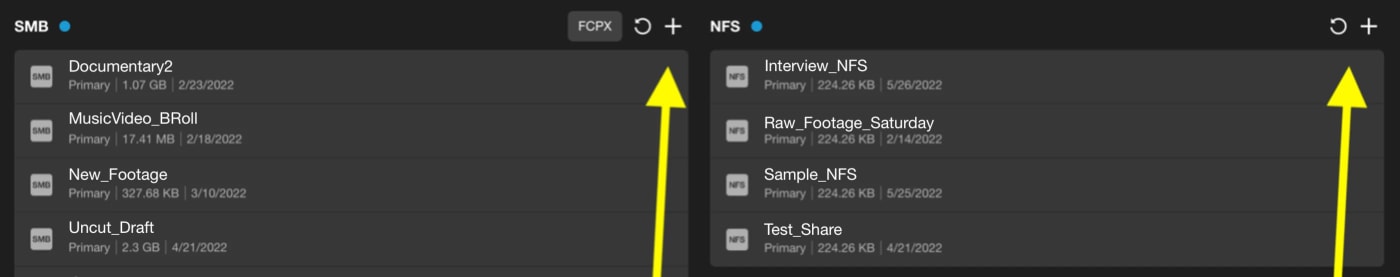
- Below the name of each share, you’ll find the name of the data pool (Primary in the above examples), their size, and the date they were last modified.
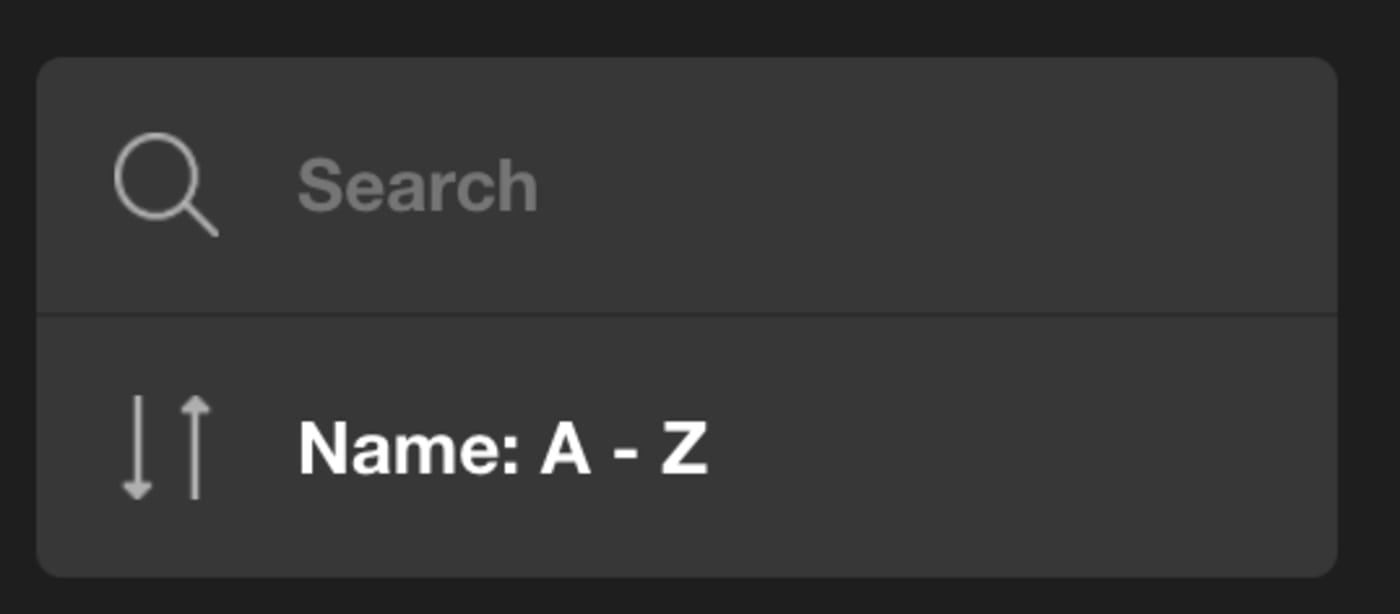
- On the left side, you’ll see a search bar which will be helpful if you have a large volume of shares and need to find a specifically named one. You can also sort your shares in a variety of ways.
Creating/Customizing Shares
- Clicking on an individual share in either category brings up a window with its info and the optional settings. As always, you’ll have the X in the top left corner to exit this box, and the saving options on the right: a trash can icon to discard any changes you’ve made, and a checkmark to save them.
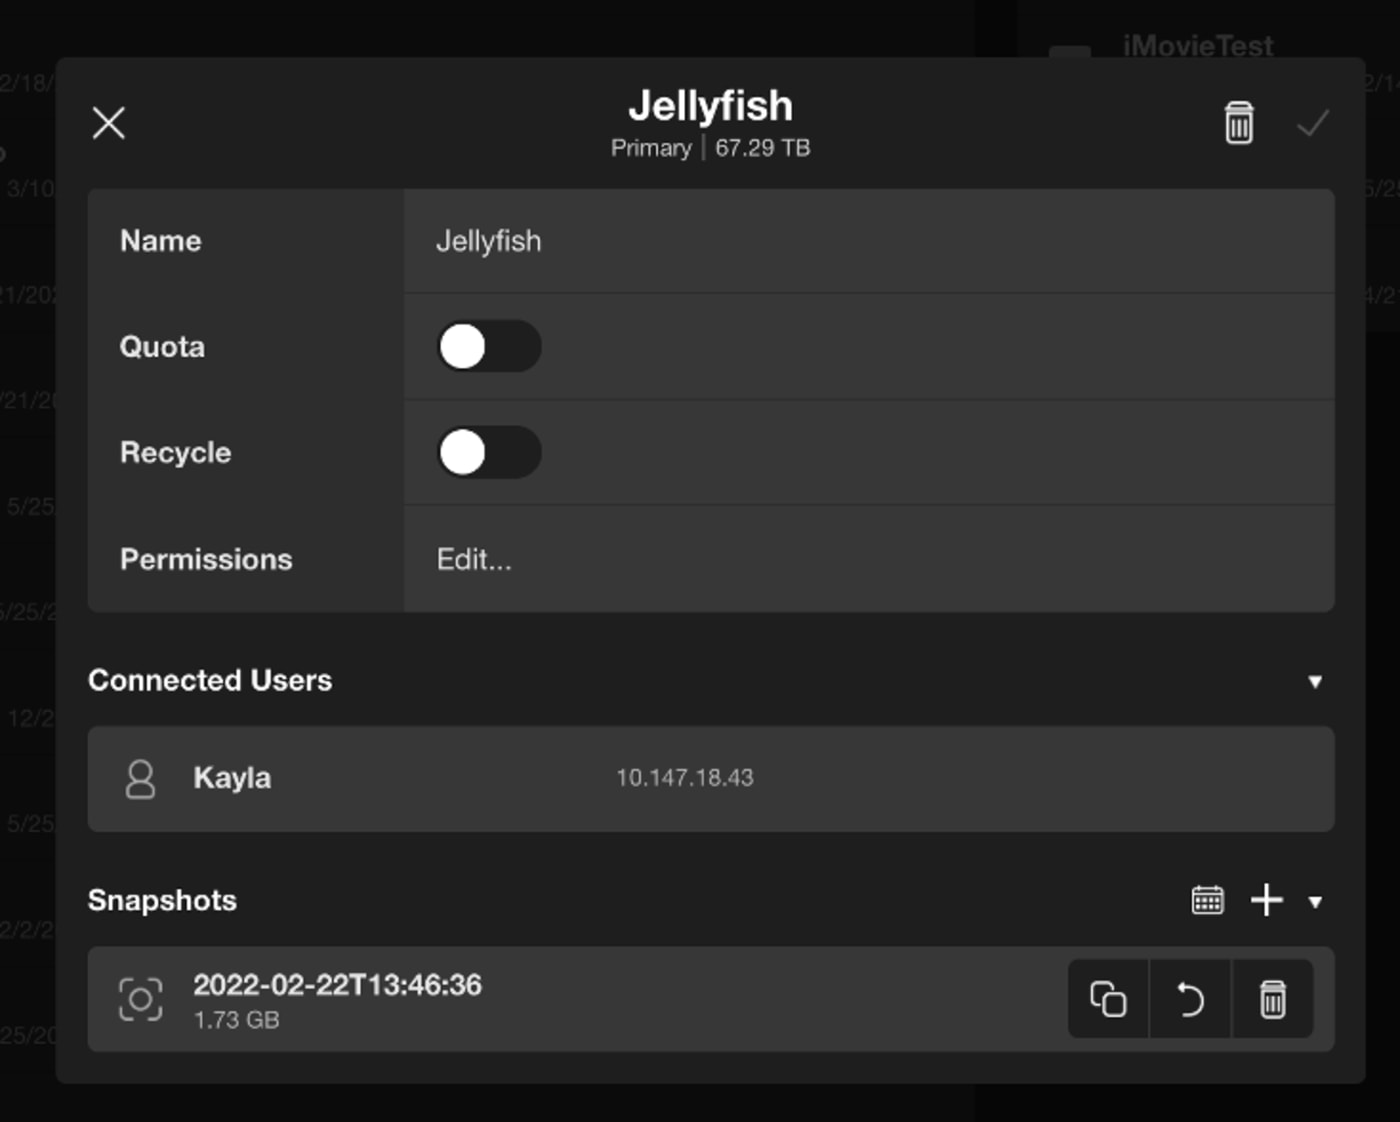
- At the top, you’ll see the name of the share, and under it will be the name of its data pool, and its size. The first part of this menu lists the name of the share. Important note when creating names for shares: it will not allow spaces or special characters.
Quote: Manages the space that users may take up with this share. If you’ve got an editor who leaves raw files all over their system without deleting them when finished, using this option will force them to keep their digital workspace tidy. When you toggle Quota on, you can type in a value for the number of terabytes of space this share can take up, out of your total available space.
Recycle: Allows you the option to keep a recycle bin. Without this, deleting files will be permanent.
Permissions: If you click on Edit next to permissions, this is where you can choose who will have access to this share. Only Admin users can add users to shares, make sure to do this for every user when you first setup your OWC Jellyfish, otherwise your users won’t be able to access files on the designated share spaces. Think of it like giving a key to every person who needs to get in that specific OWC Jellyfish share space.
Connected Users: Lists all users that are currently connected to your share, as well as their IP.
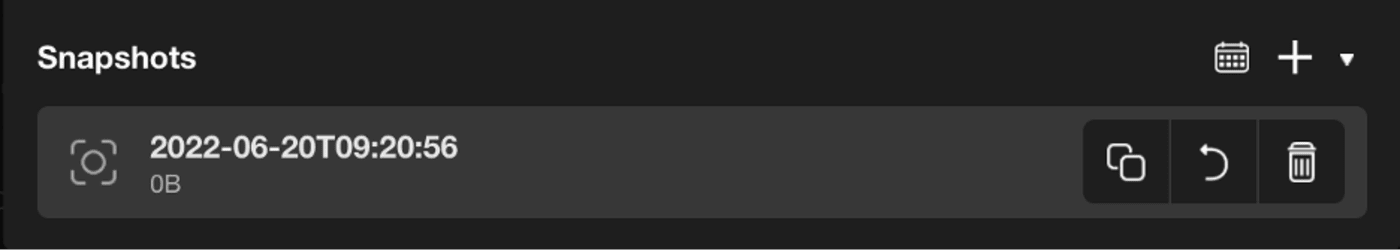
Snapshots: Creating a Snapshots task will allow you to see the changes made to files in the share beginning with the day you turn this feature on. You’ll see three icons on the right side of the Snapshots row: a calendar, a plus sign, and an arrow.
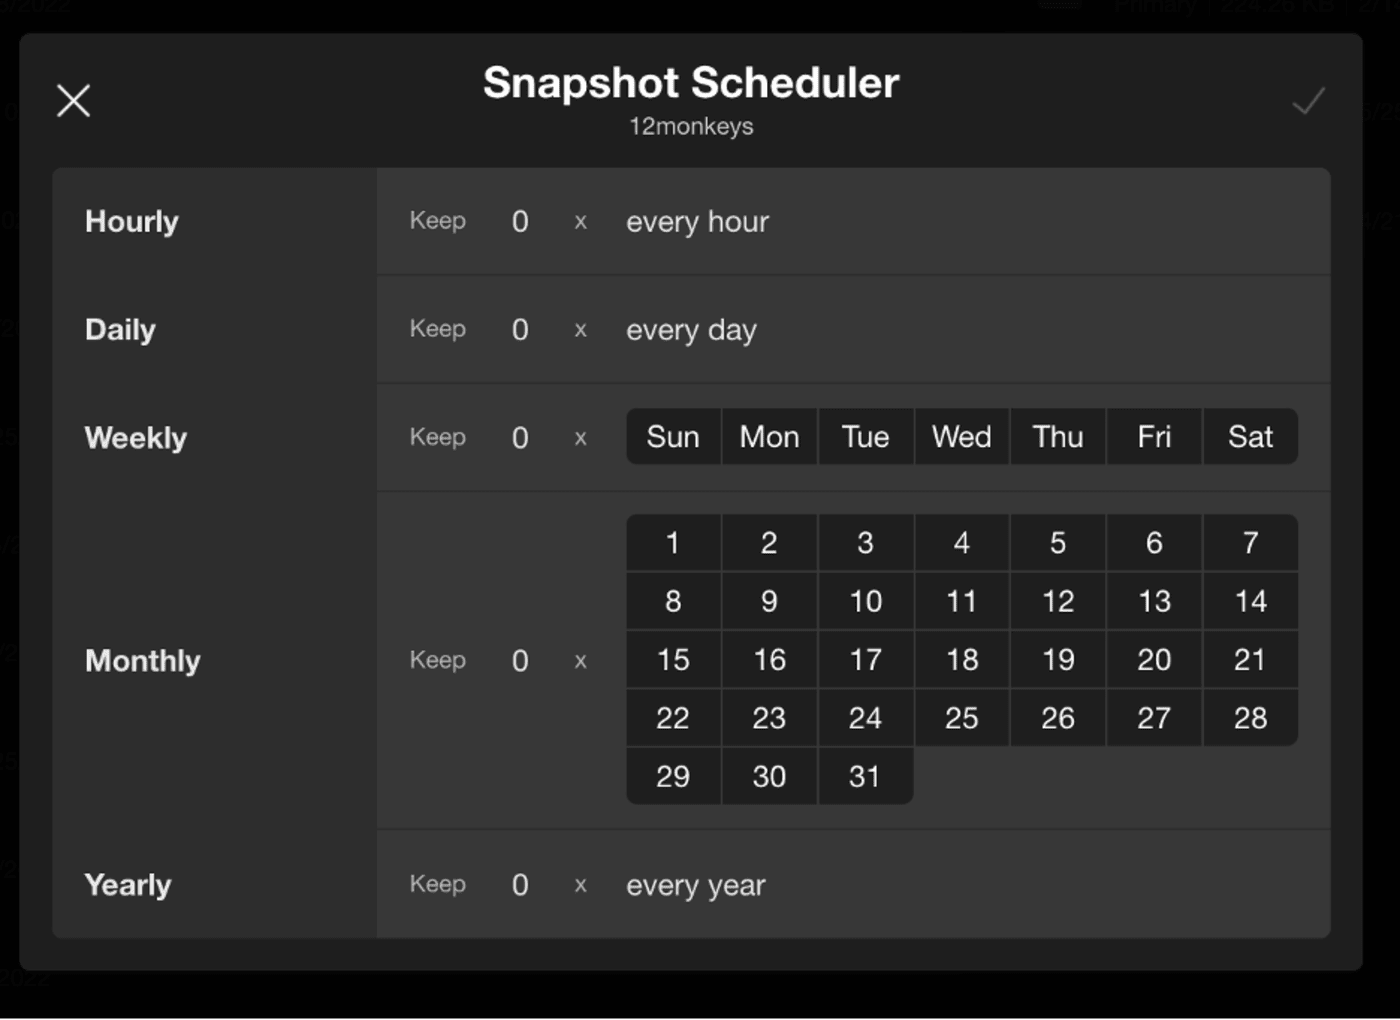
- The calendar icon will bring up your Snapshot scheduler. Here you can decide the frequency and volume of snapshots and how many to keep.
- The plus sign will create a new Snapshot task, and it will keep a list in this box until you delete the Snapshot. The arrow collapses or expands your list of recorded Snapshot.
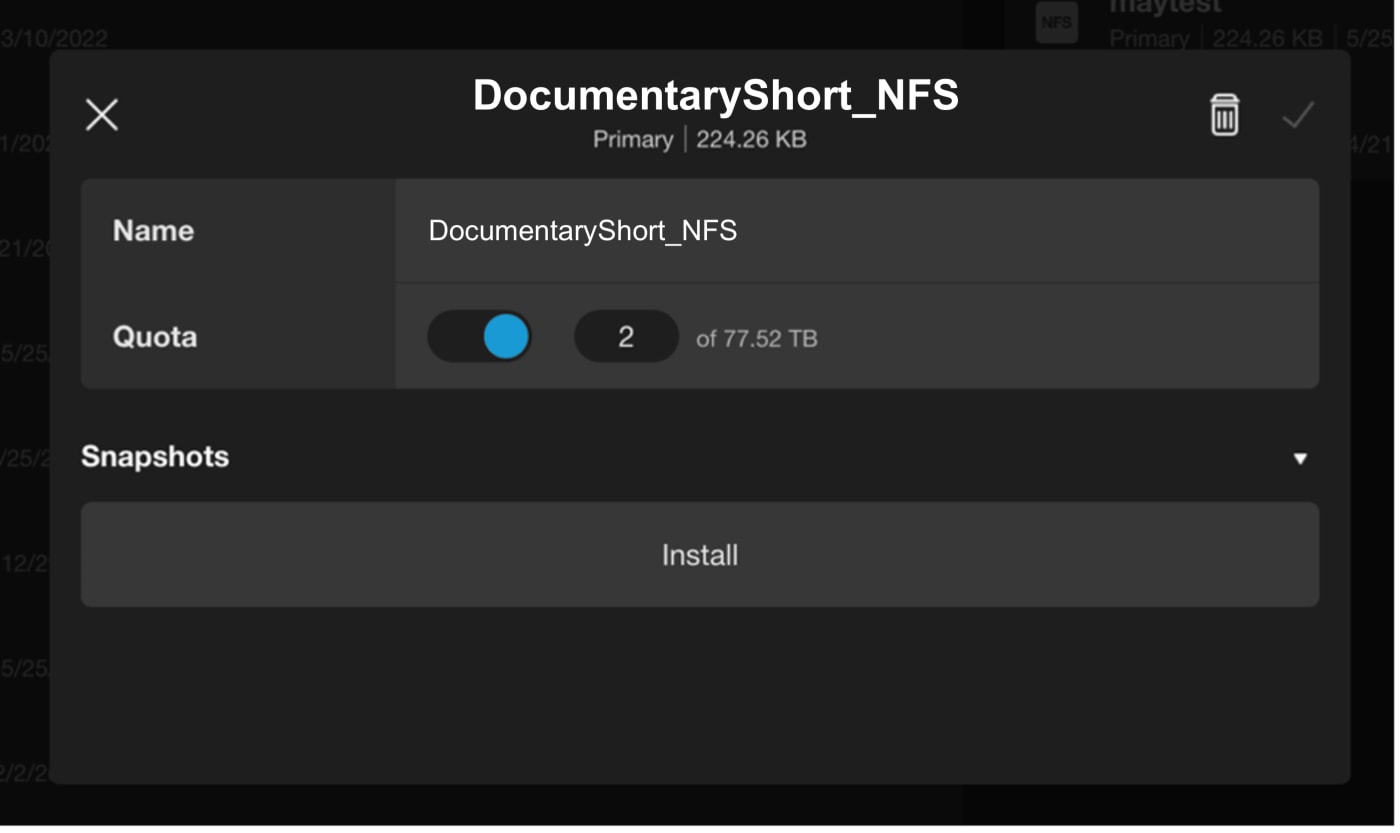
NFS Shares
- Up next, we will have a look at the similar, but slightly different, NFS shares. When you click an NFS share, you’ll have an information box pop up with much of the same: the name of the share, its data pool, and its size. On either side of this info are the familiar X, trash can icon and arrow.
- There are similar features as an SMB share, but fewer of them. The Name, Quota toggle button, and Snapshots dialogue are all you’ll see in this box.
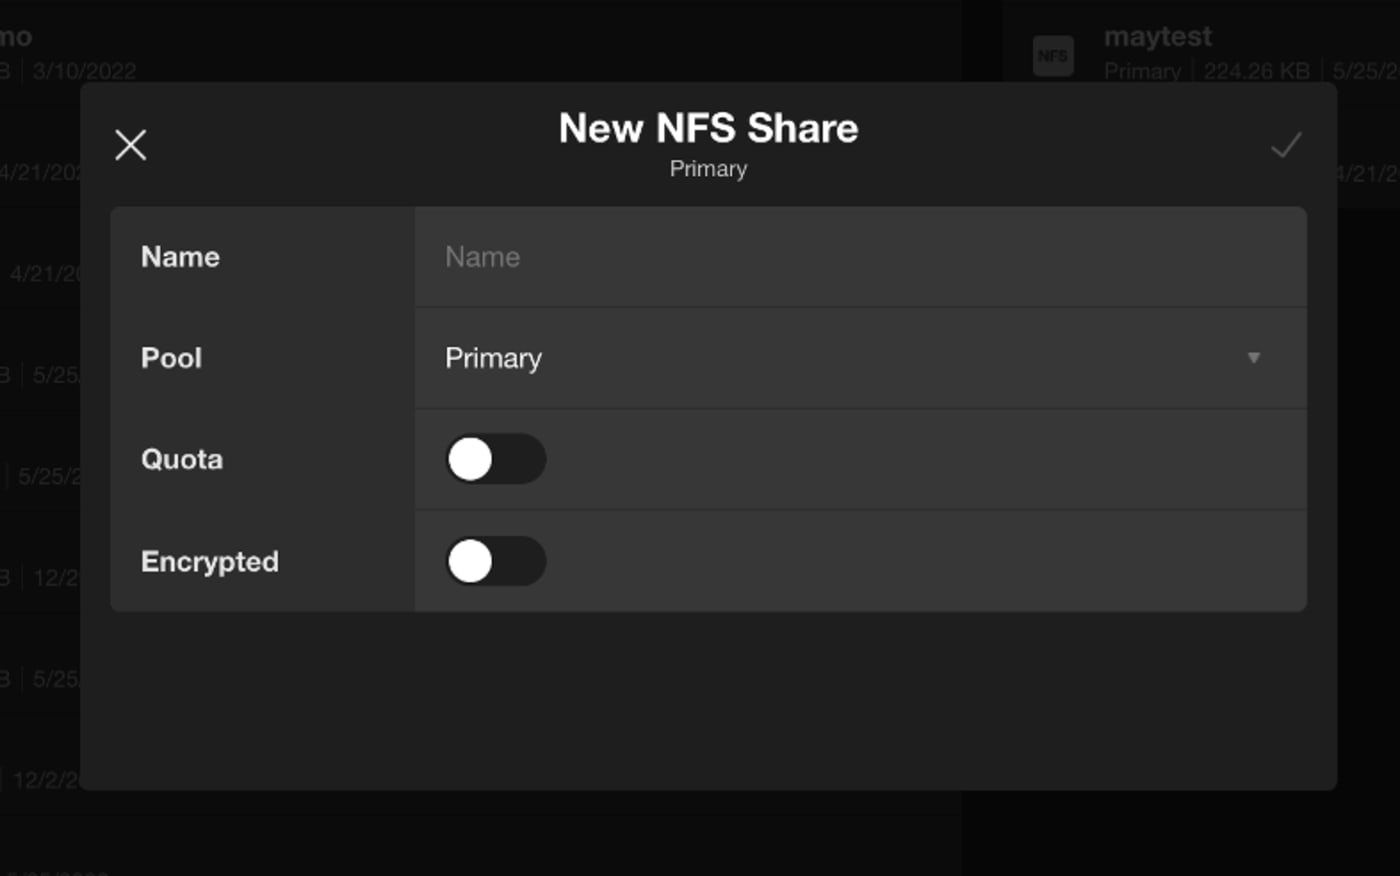
- Similarly, if you go back to the list of shares and click the plus sign to the right of the NFS list, you’ll get a new dialogue box. You’ll get everything as you would with an SMB share, except no option to toggle a Recycle option.
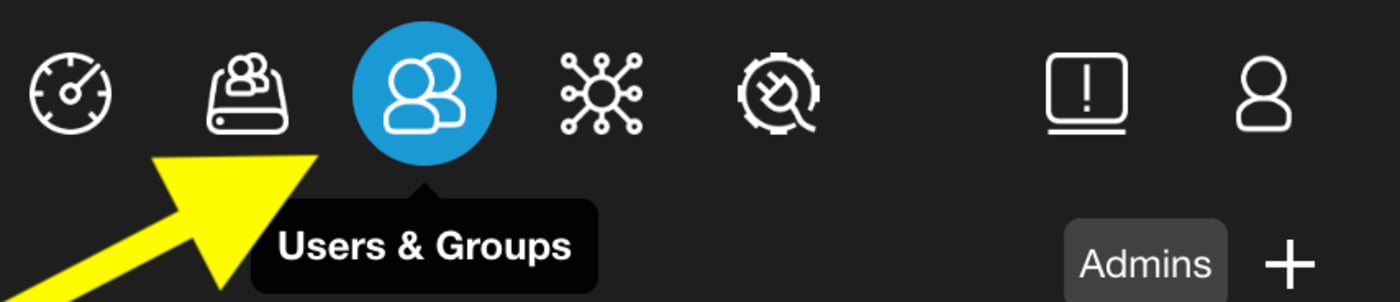
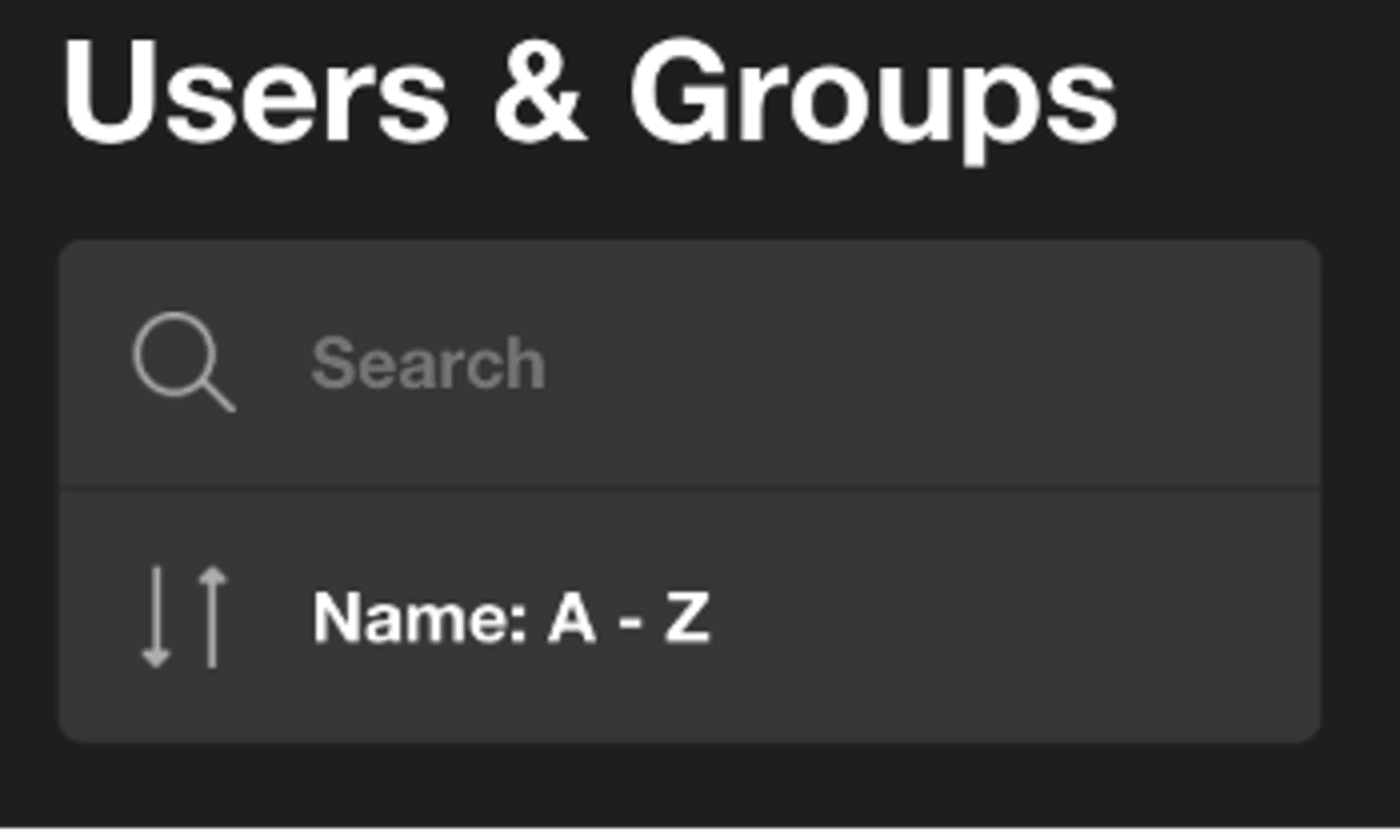
Users & Groups
- The Users & Groups tab is where your admin user can add new users, create groups of users and set user permissions. Similar to your Shares, you’ll see on the left side a search bar to search by name for a user or group. Under that, you’ll see an option for how you would like to order them.
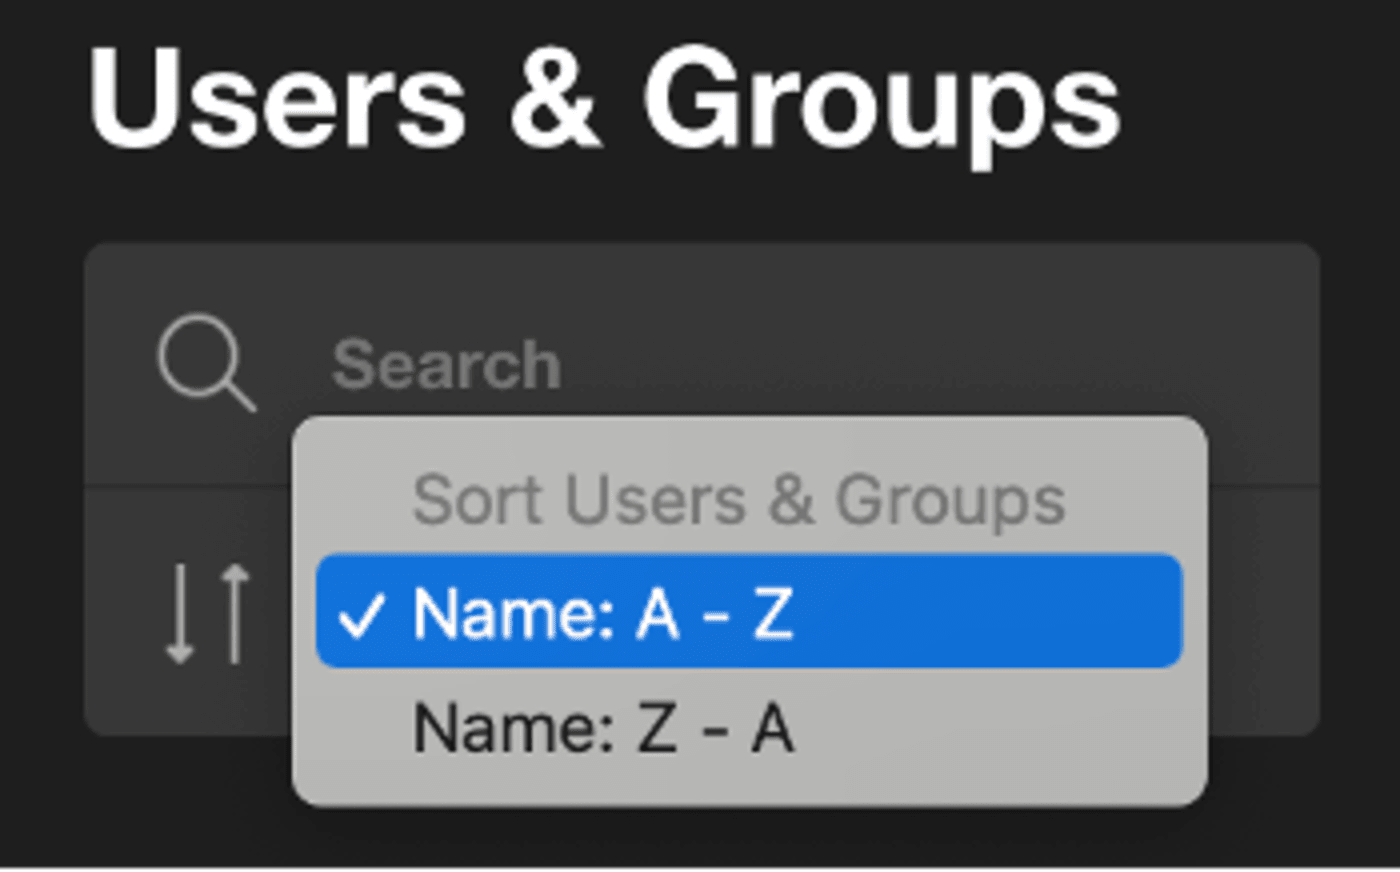
- You can use the drop-down menu to organize them alphabetically or in reverse alphabetical order.
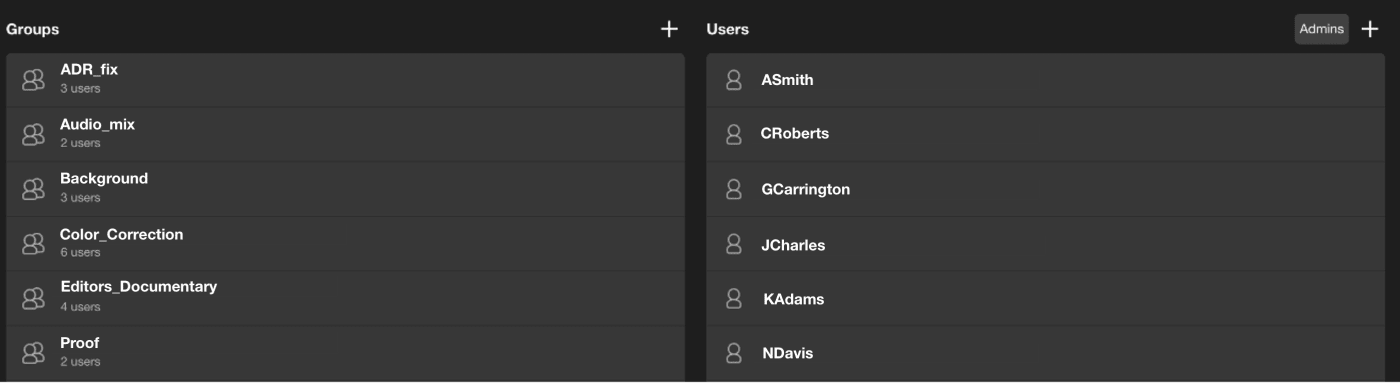
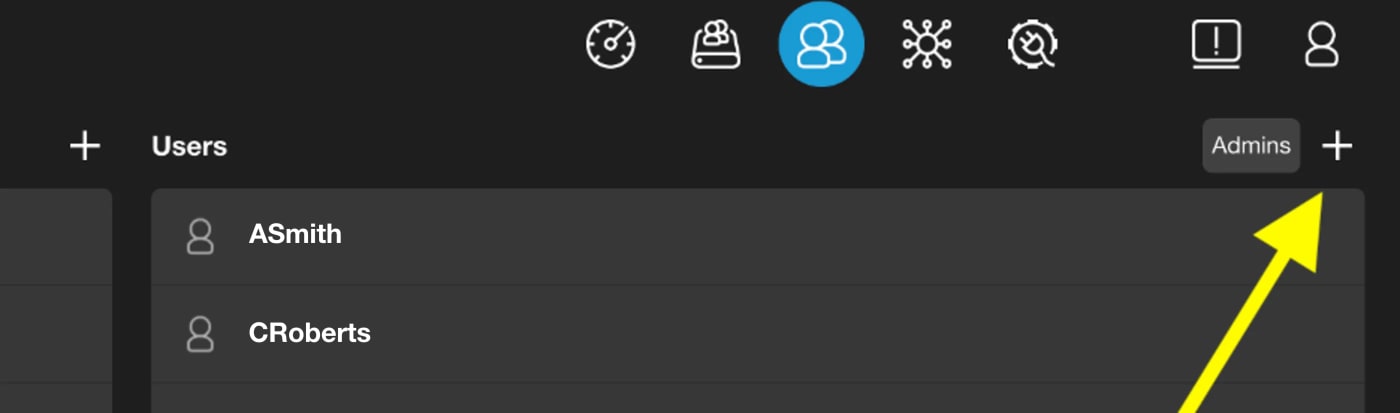
- You will see populated lists of Groups on the left side and Users on the right side. To the top right of each of those lists, you’ll find a plus sign that will open a dialogue box to add a new group or new user. On Users, you’ll also have the option to switch your view to only include administrators by clicking Admins.
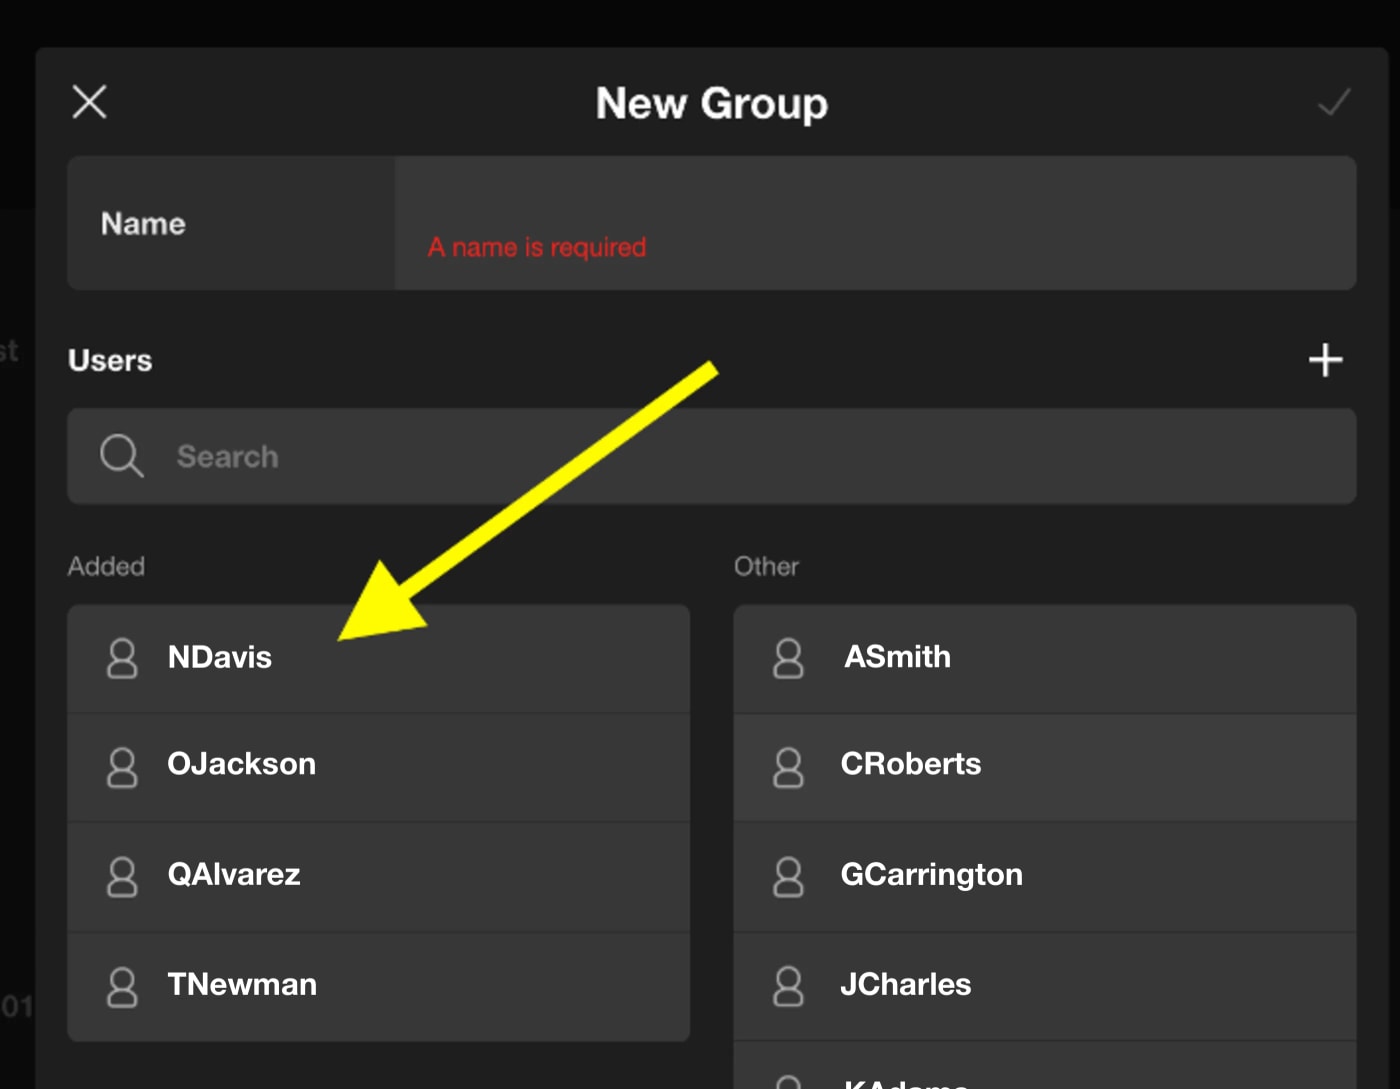
- When you click the plus sign to add a new group, the following dialogue box will appear.
Creating A New Group
- If you are tasked with creating many user accounts with identical permissions, you may opt to create groups, and add the users later. To start this process, click the plus sign next to Groups. Enter the desired name of the group in the Name field.
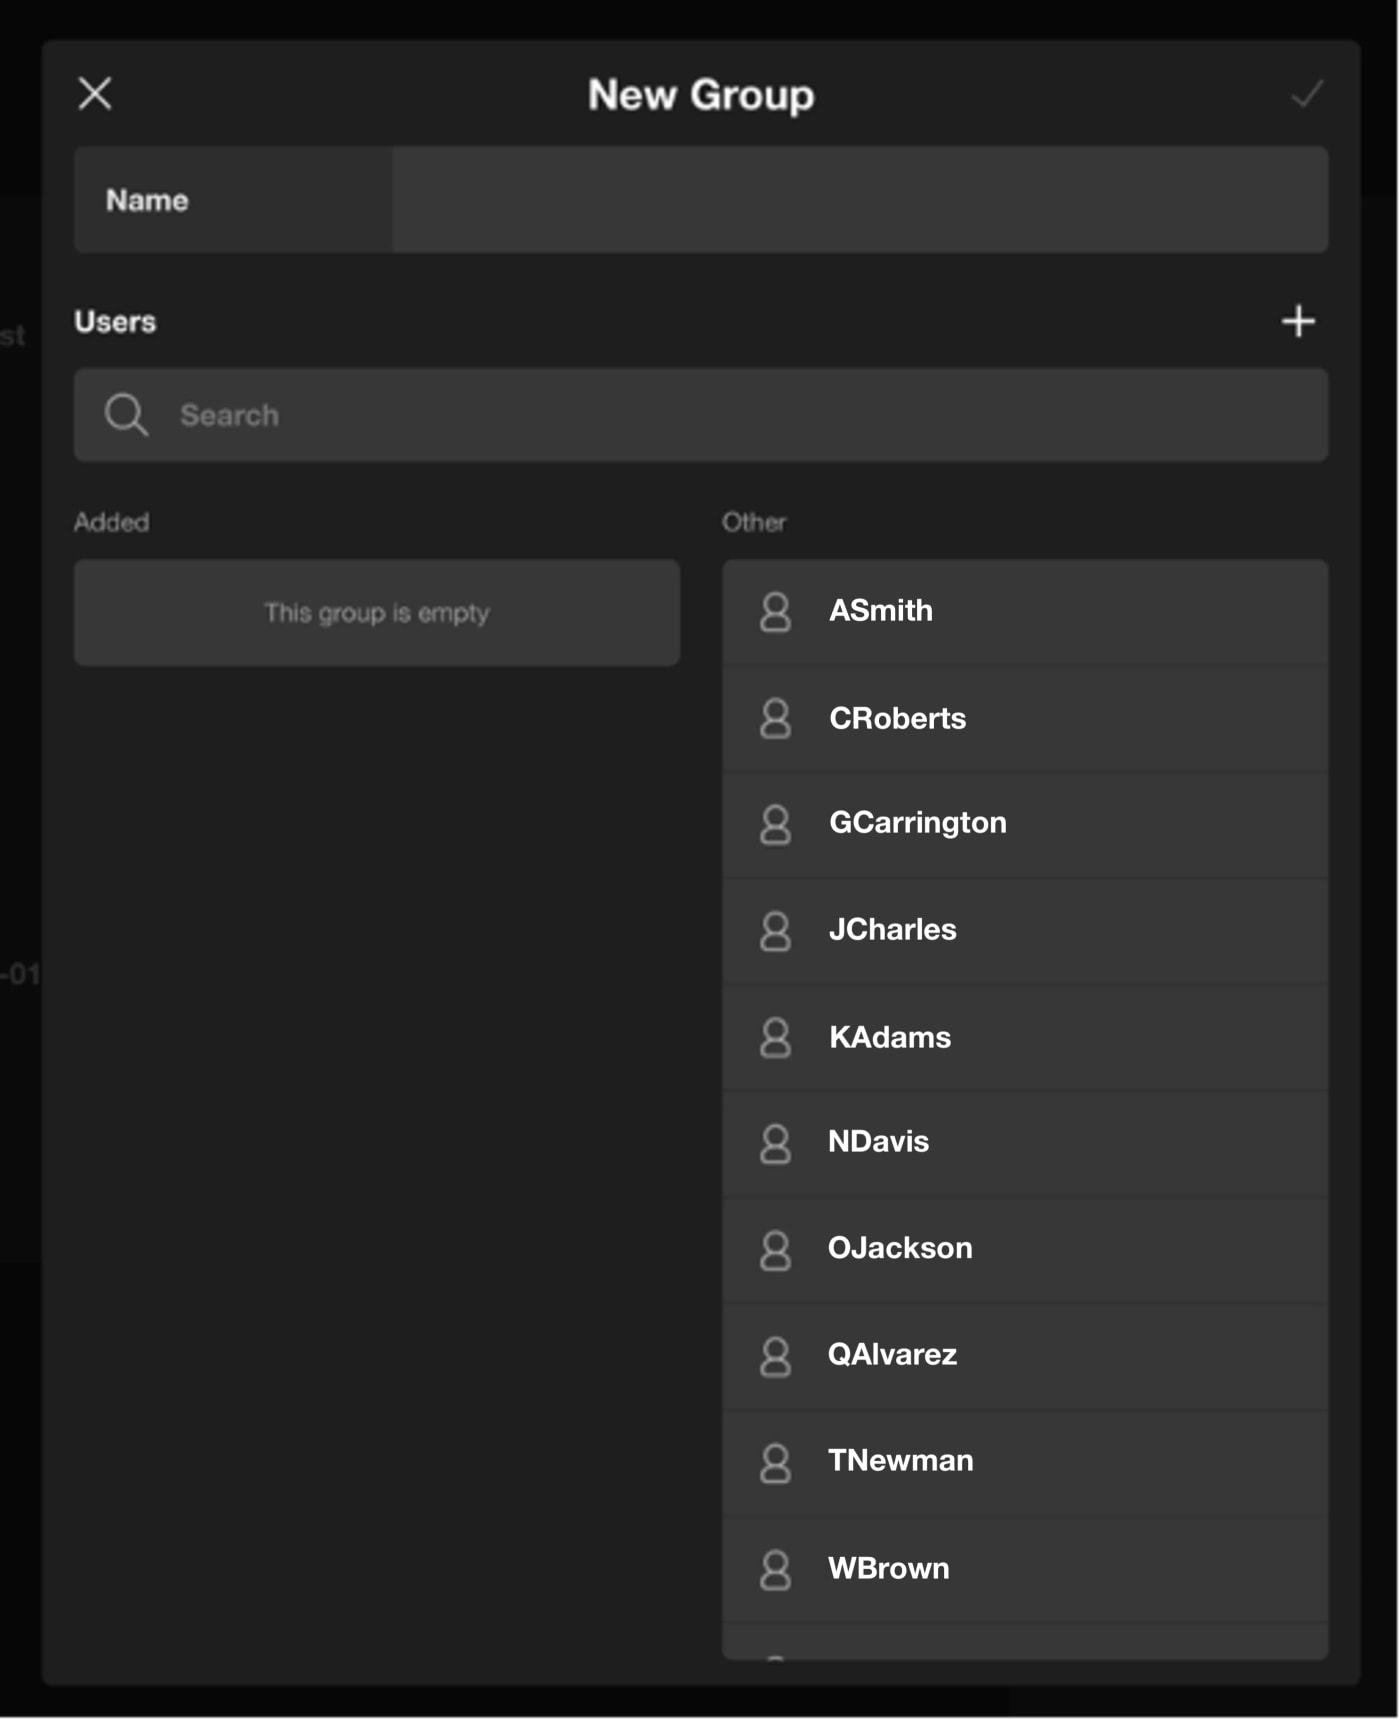
- You can add users to this group in multiple ways. You can search for registered users to add to your group in the search box by typing their name. Registered users in your system will begin to populate. You can also just scroll down the list marked “Other” and click on users that have already been created to add to your new group or you can create a new user within this same window by clicking the plus sign next to the Users icon. Once you add the user to the group, you can assign permissions to this group by going back to the shares tab and adding the group to your designated share.
Creating New Users
- If you don’t need to create any groups just yet, and just need to create a new user, you can do this by going to your list of users and click the plus sign.
- The same dialogue box will pop up with all the information and options you’ll need to enter for a new user. Once finished, the checkmark saves your settings, and the X on the left will exit this dialogue and ask you if you’re sure you’d like to exit.
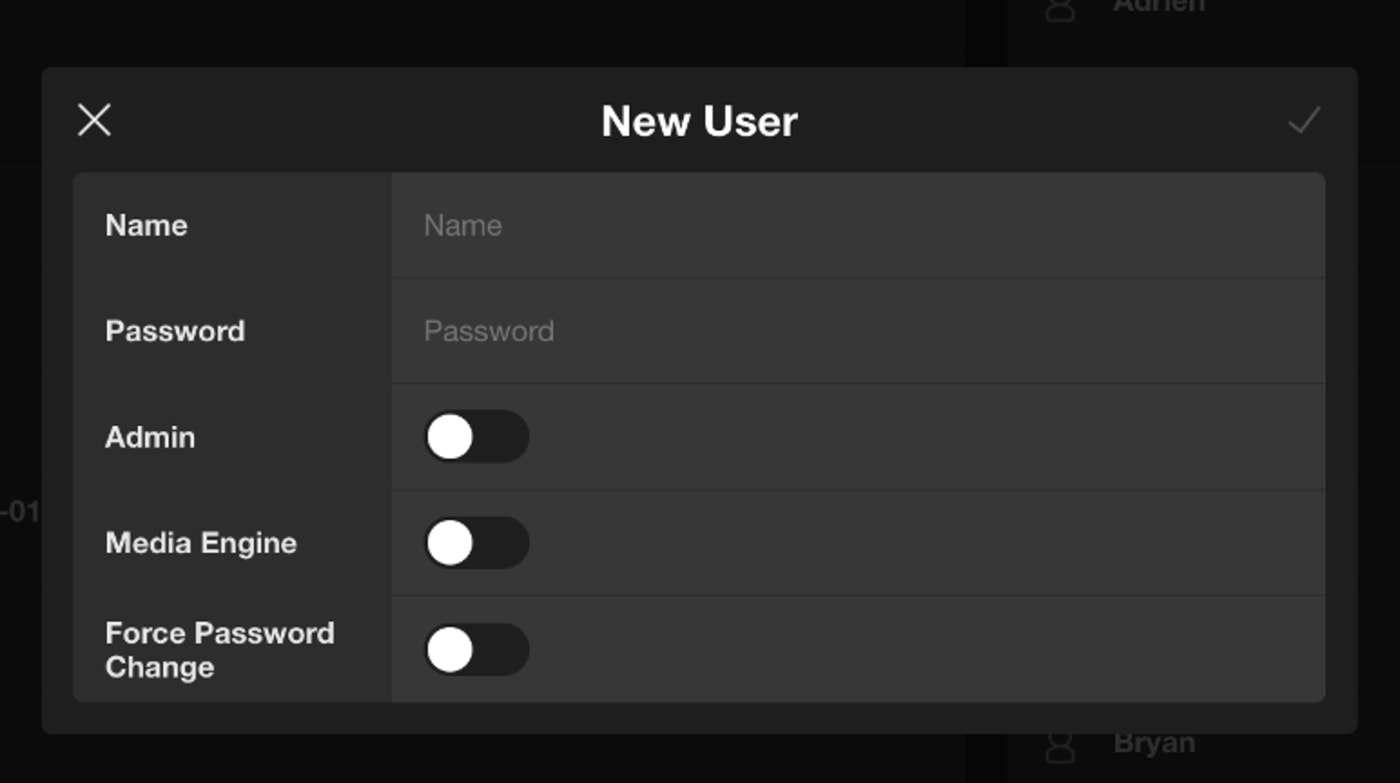
- When creating a new username and password for you and your team, toggle the following buttons on if the following applies to the user.
Admin: Toggle this on if the user you’re creating is going to be an admin for the OWC Jellyfish – will have the ability to create new users, new shares, delete shares or users and manage user passwords.
Media Engine: Toggle this on if the user will need to make proxy files. This will enable the user to use the OWC Jellyfish Media tool located in the resources section of the OWC Jellyfish connect app. You can also access Media engine by typing OWC Jellyfish/media in any web browser. Keep in mind you need to have the media engine button toggled on for your user to access this tool.
Force Password Change: Toggle on if you want your user to be able to create their own username once they connect to the OWC Jellyfish in the Connect app for the first time.
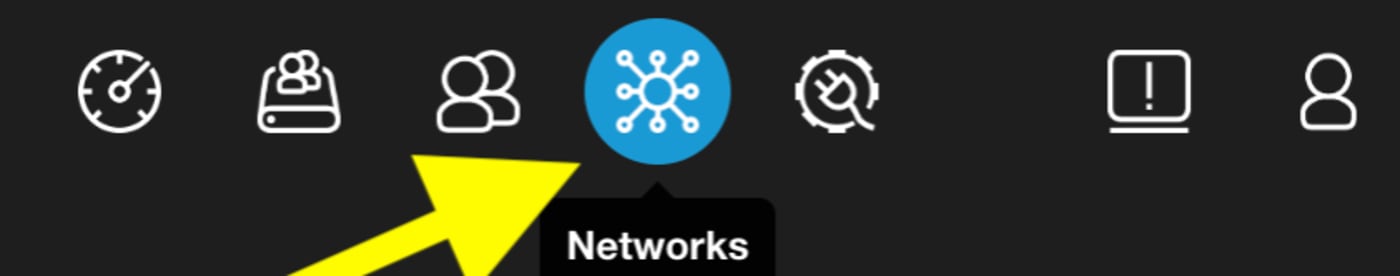
Networks
- Your Networks tab is a great hub for your IT team. It will display a list of networks, and a list of bonds. Your IT team can change advanced settings in this section. Each row in the Networks list contains your Port number, in this case numbered 1 through 6. Next will be an indicator of its state (blue if connected and functioning properly, grey if not). Next it will list its IP Address and Subnet Mask. Default Route and DHCP columns both are indicator columns, showing blue if they are connected and online. Lastly, the Speed column shows the speed of the connected workstation.
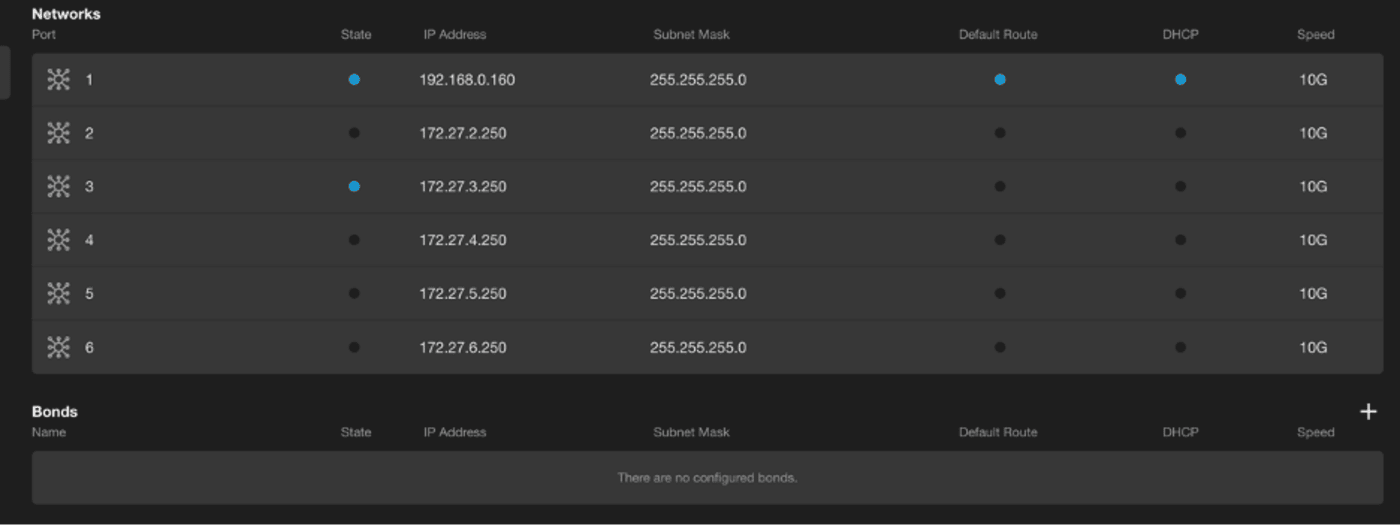
- Under Bonds you will see a list of configured bonds, if any, with almost identical columns as the networks list above: Name, State, IP Address, Subnet Mask, Default Route, DHCP, and Speed. At the top right of the Bonds category, you’ll find a plus sign to create a new bond, bringing up a brand-new dialogue box.
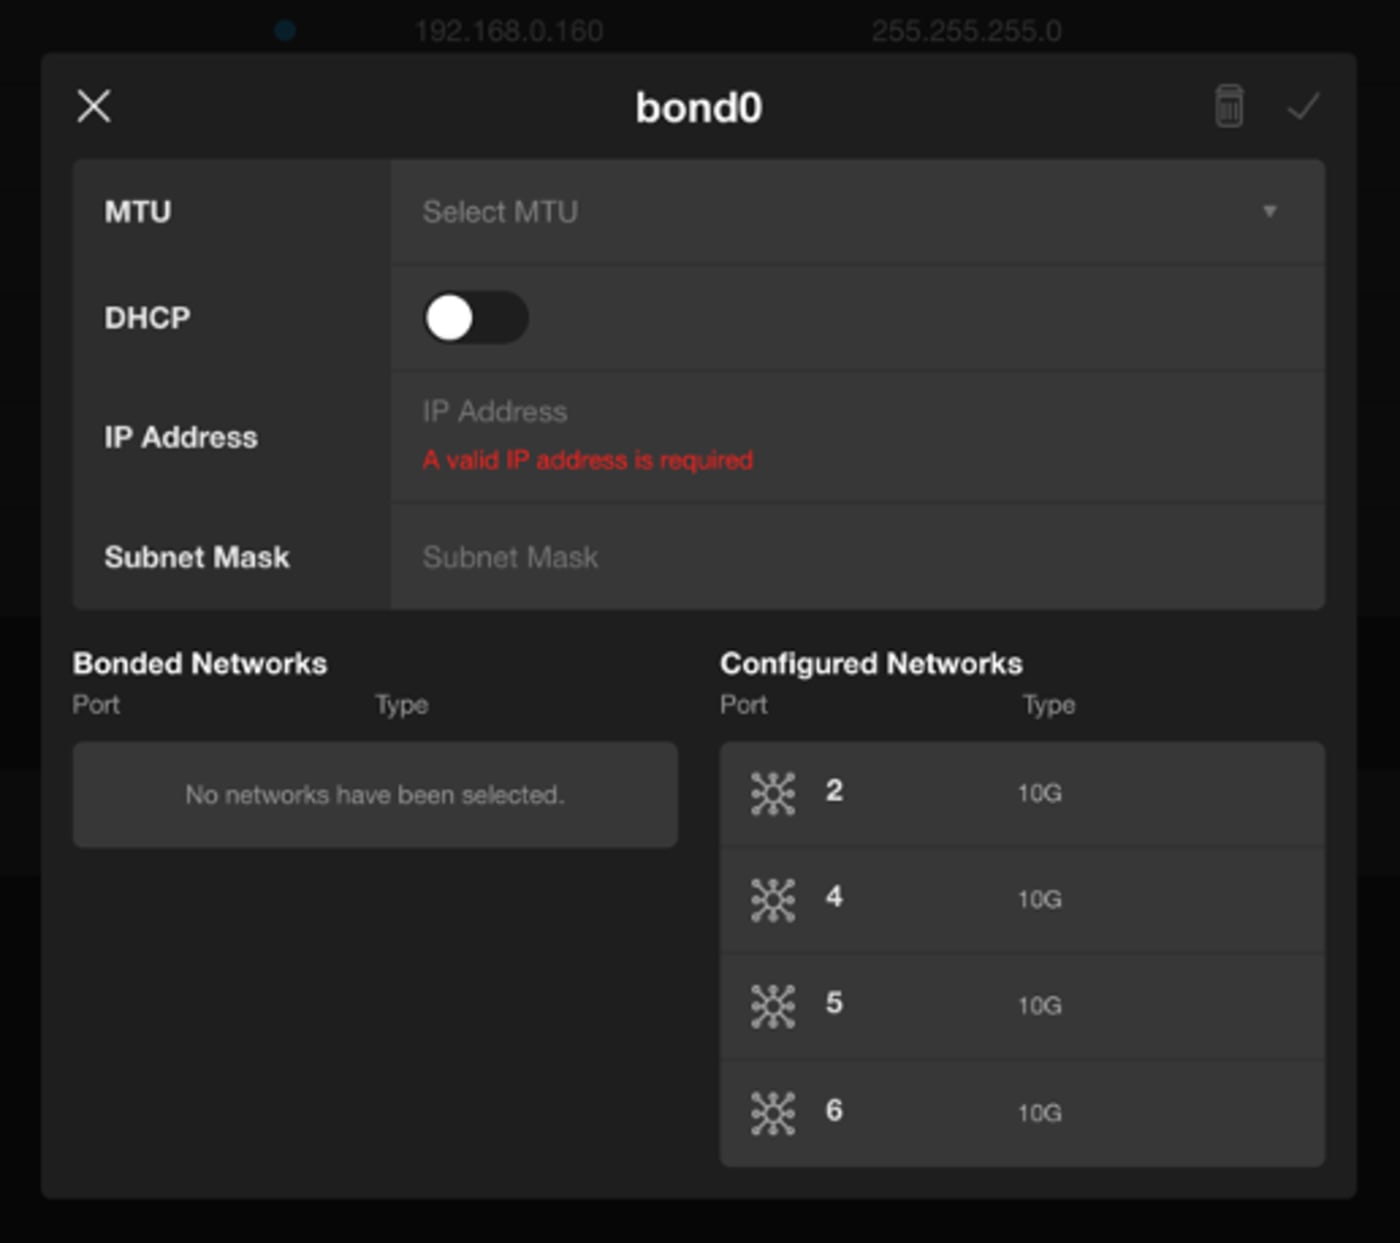
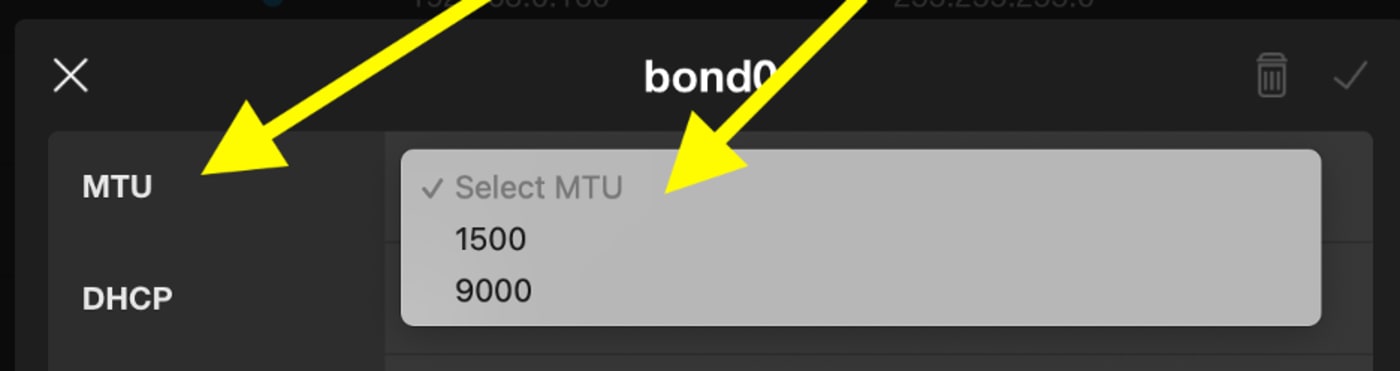
- If it is the first bond created for your list, it will automatically name it bond0. You’ll see some familiar faces at the top: X, trash icon, and checkmark, ready for their usual commands. The first line of options is MTU, which allows you to choose a maximum transmission unit to be configured with this network port. There is a drop-down list for this. In the example, you can choose 1500 or 9000.
- The DHCP toggle button allows you to set the port to obtain an IP address from your network. If you choose to keep this off, you can manually enter that information in in the next two rows, IP Address and Subnet Mask.
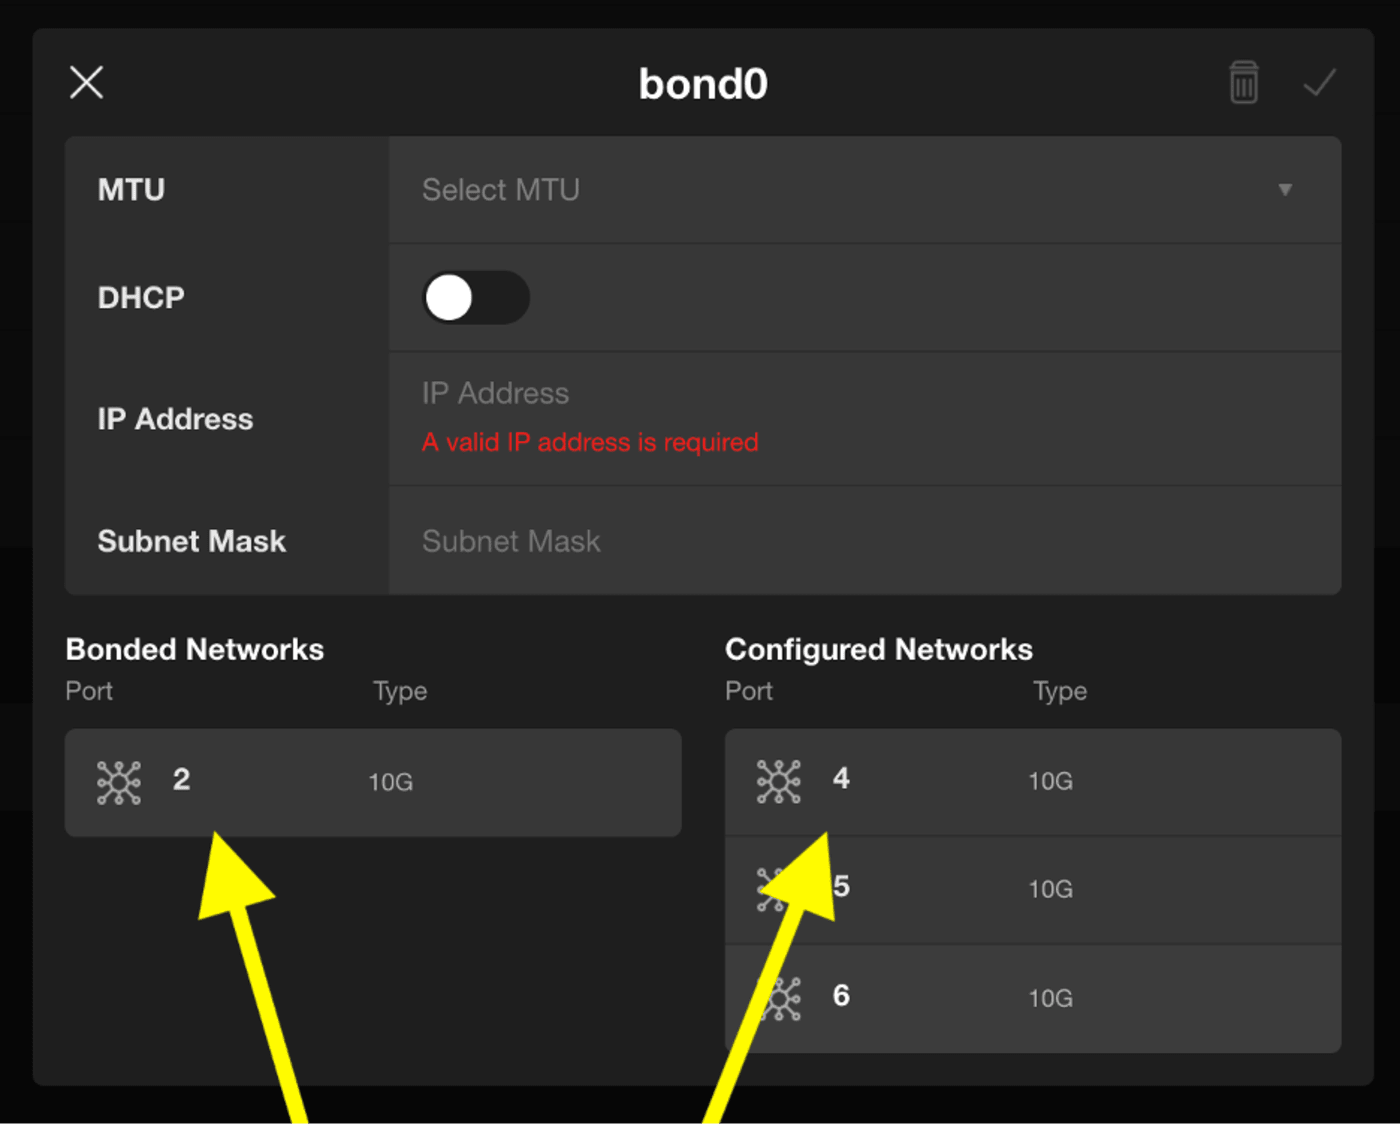
- The field on the bottom right has clickable entries for ports labelled “Configured Networks.” Clicking on any one of these will add it to the Bonded Networks list on the left. If any changes are made in error, click the X at the top left and leave the changes unsaved.
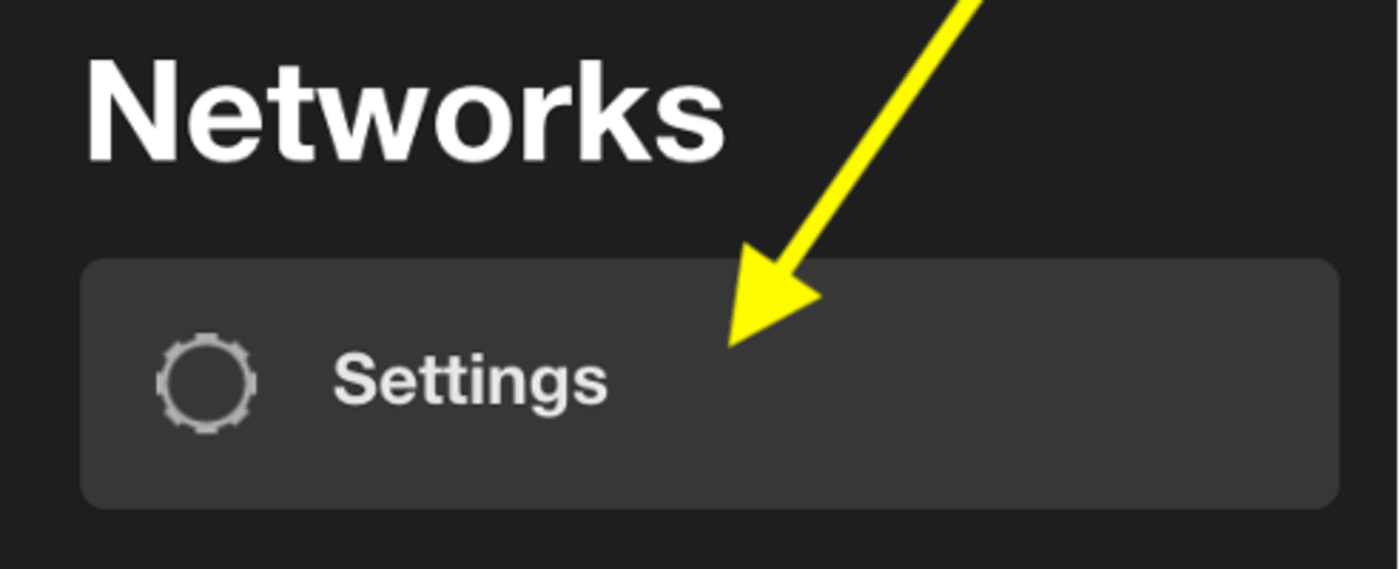
- Outside of these lists, your IT personnel can go into the advanced settings for your OWC Jellyfish’s network connection by clicking “Settings” on the top left of the screen.
- A dialogue box will appear here with several fields. DNS 1 will be the primary DNS server for your OWC Jellyfish. DNS 2 is the second DNS server that will be used in the event the first is unresponsive. DNS 3 will be the third server if the first two are unresponsive. Under Search you can enter the DNS search field. You can enter or modify your default gateway in the Gateway tab and do the same for the hostname in the Hostname field.
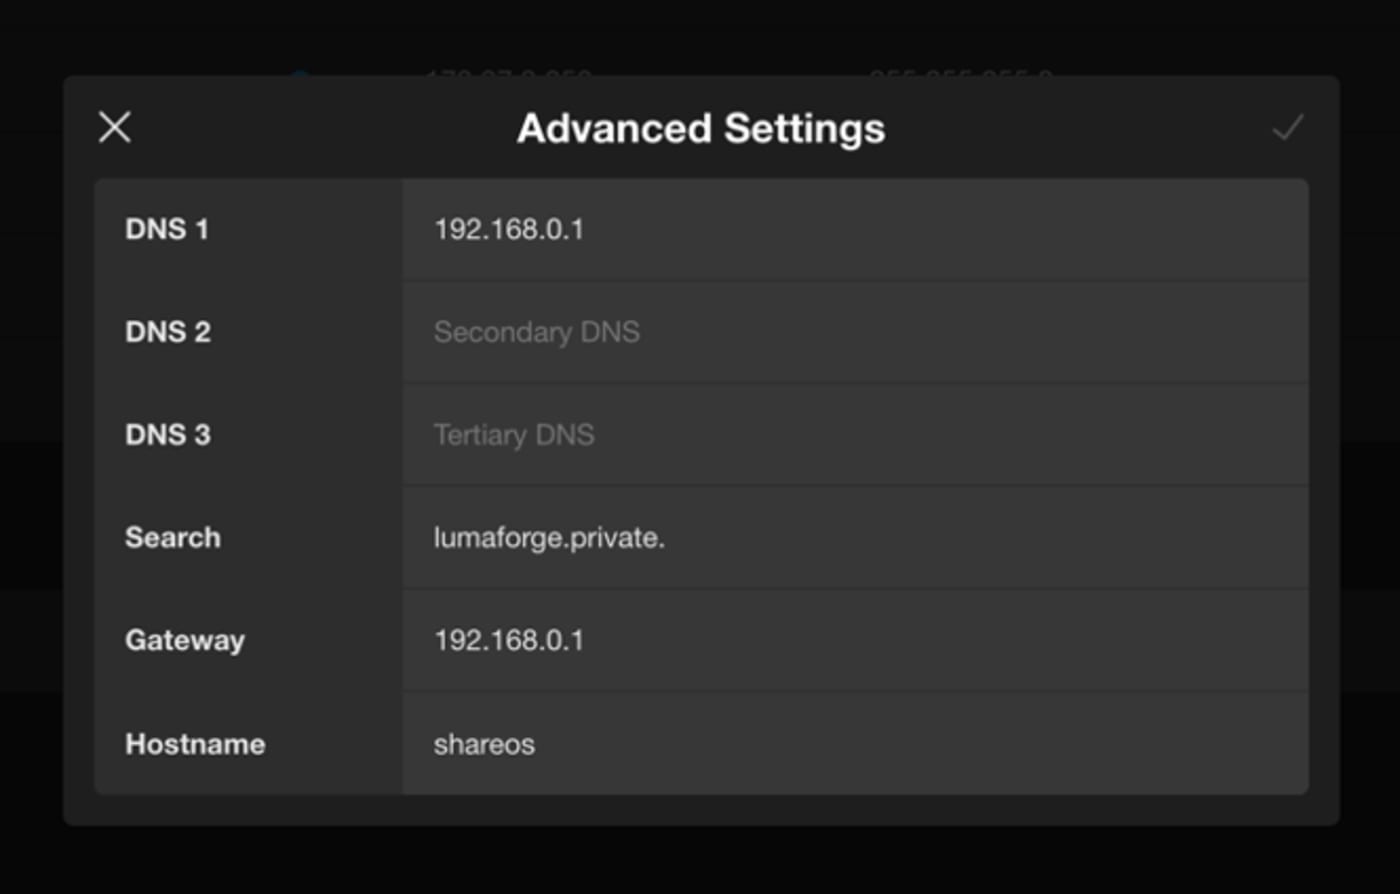
- As always, the checkmark on the top right will save any changes made. The X will allow you to exit, and prompt you to decide whether you’d like to discard or save any unsaved changes.
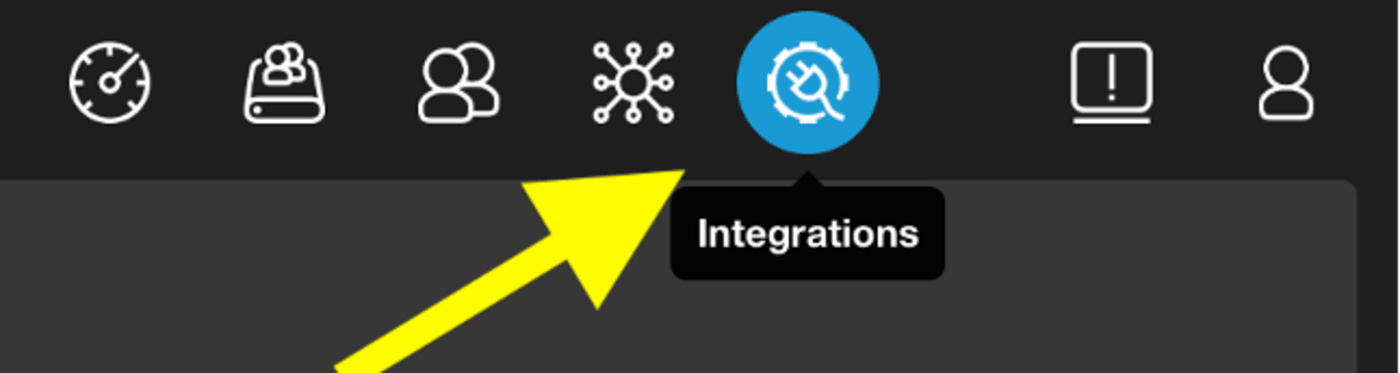
Integrations
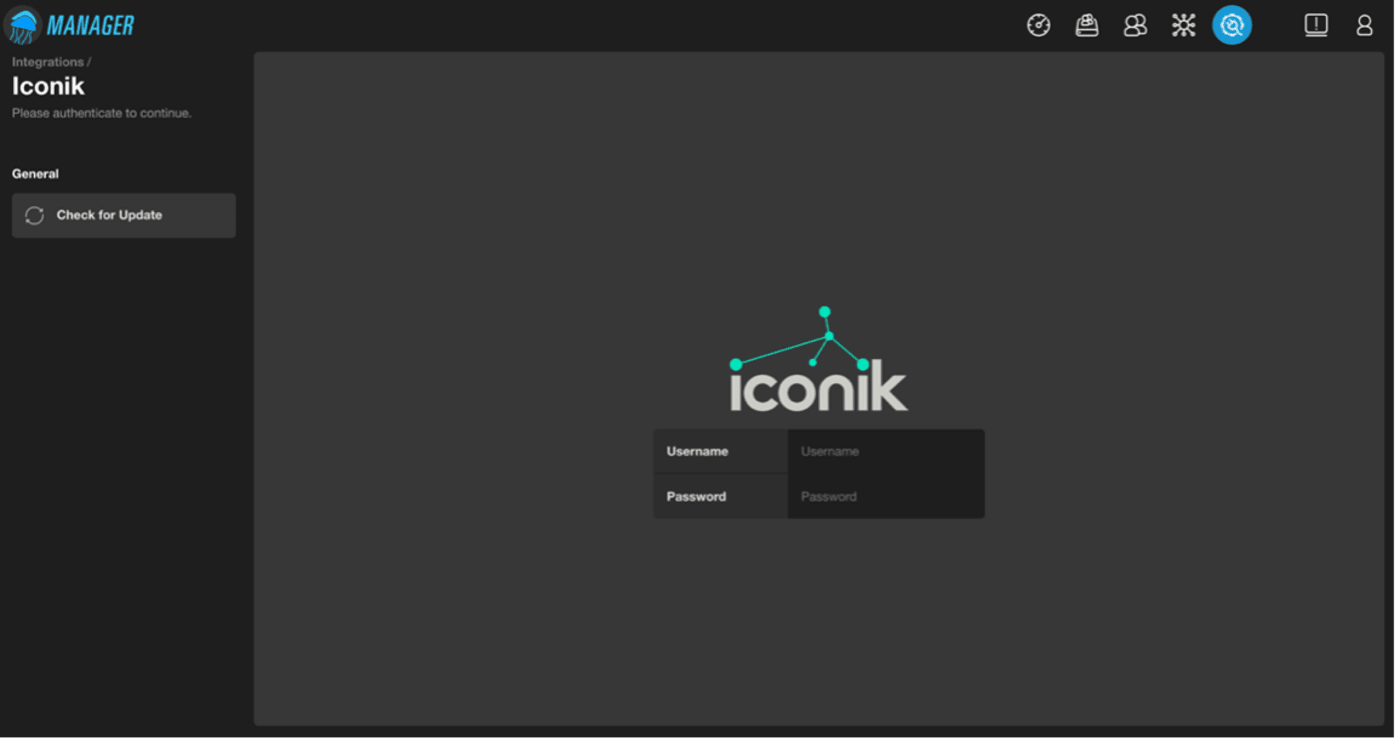
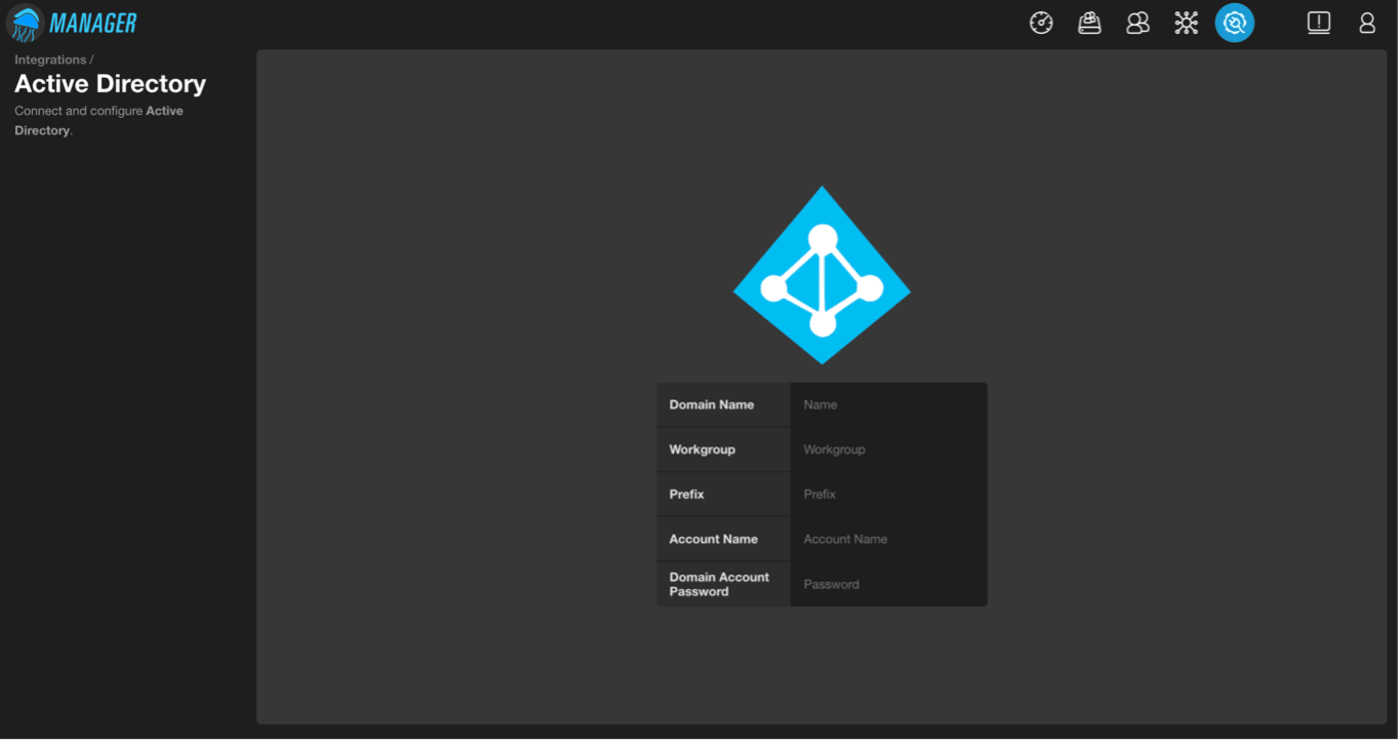
- Your Integrations tab will bring up a list of applications that work seamlessly with your OWC Jellyfish. Next to each of these items is a status indicator that will turn blue when you have successfully configured the application. You may choose to not configure some, depending on the needs of your workflow. You must have your Jellyfish connected to the internet to activate external vendor integrations and you will need to reach out to our support team to assist you with activating your Active Directory integration.
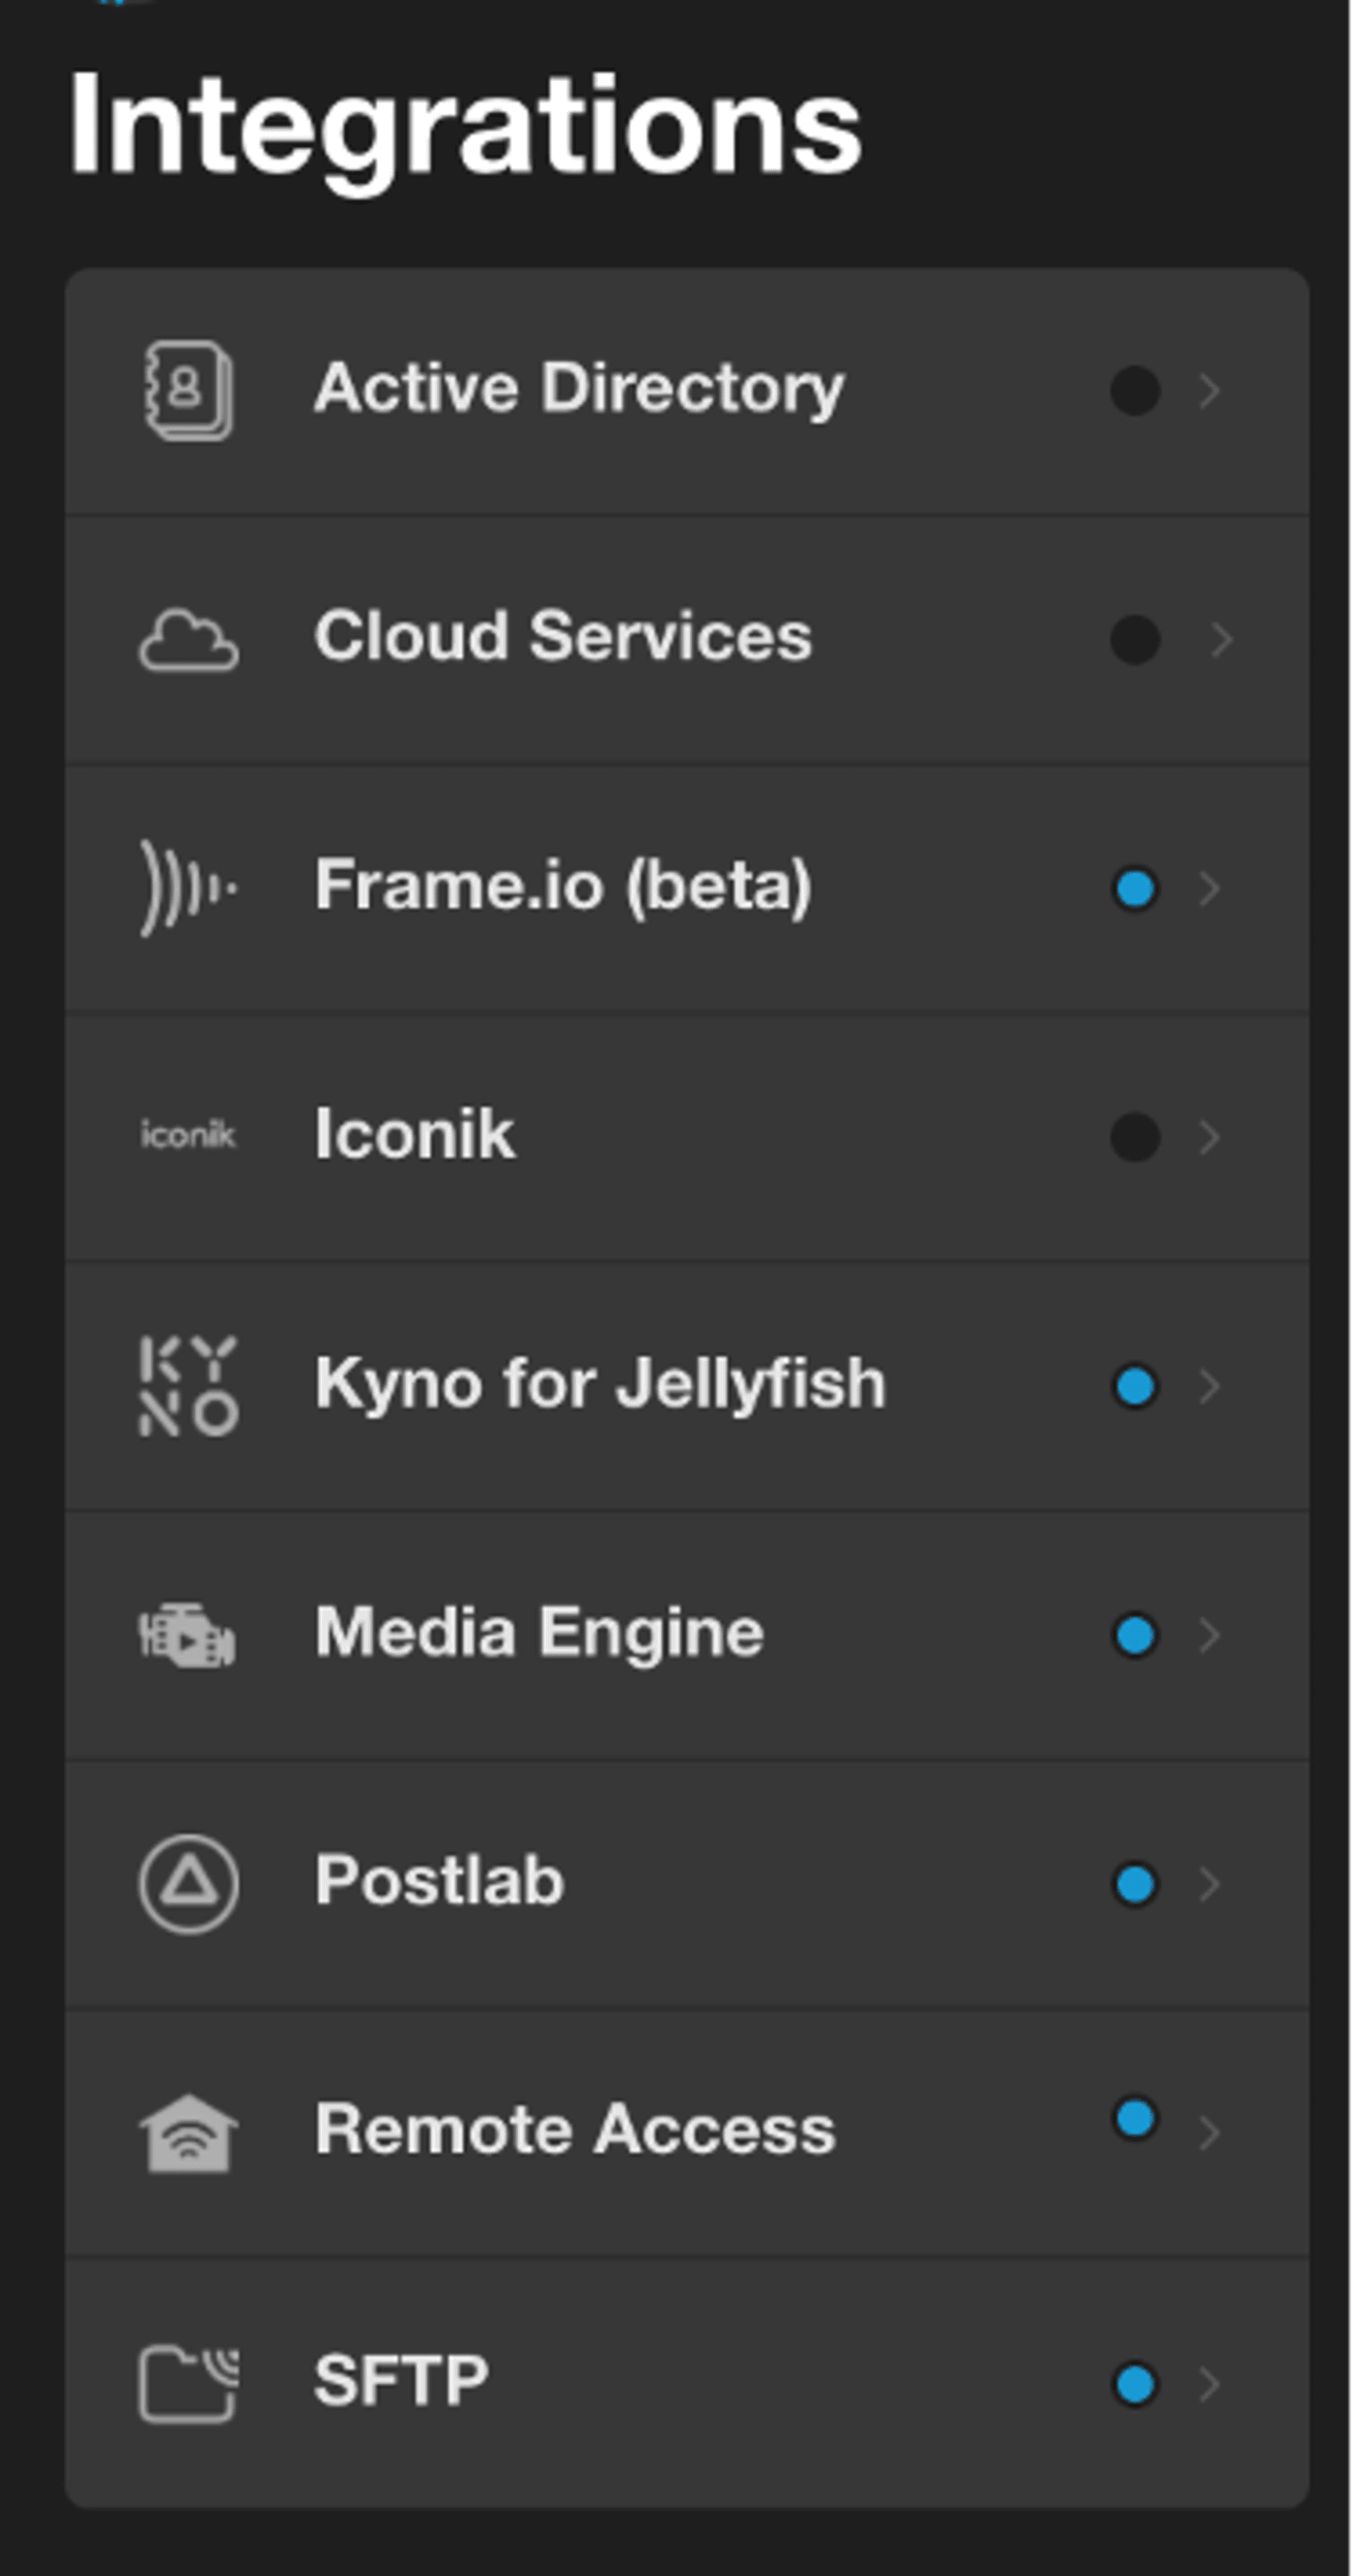
- Clicking any one of these will bring up dialogue boxes to provide account credentials you’ve set up for any of these services.
Media Engine and Kyno
- You won’t need your OWC Jellyfish to be connected to the internet to use Media Engine or Kyno for OWC Jellyfish, as it uses your workstations internet connection to access these two free tools. If you need a Kyno license, please reach out to our support team by visiting our support portal. You can download Kyno for OWC Jellyfish on your workstation and access media engine within the resources tab in the OWC Jellyfish connect app. If you’re on a windows workstation, you can visit our support page for the Kyno download and to access media engine on your windows machine, type OWC Jellyfish/media in any web browser while connected to your OWC Jellyfish.
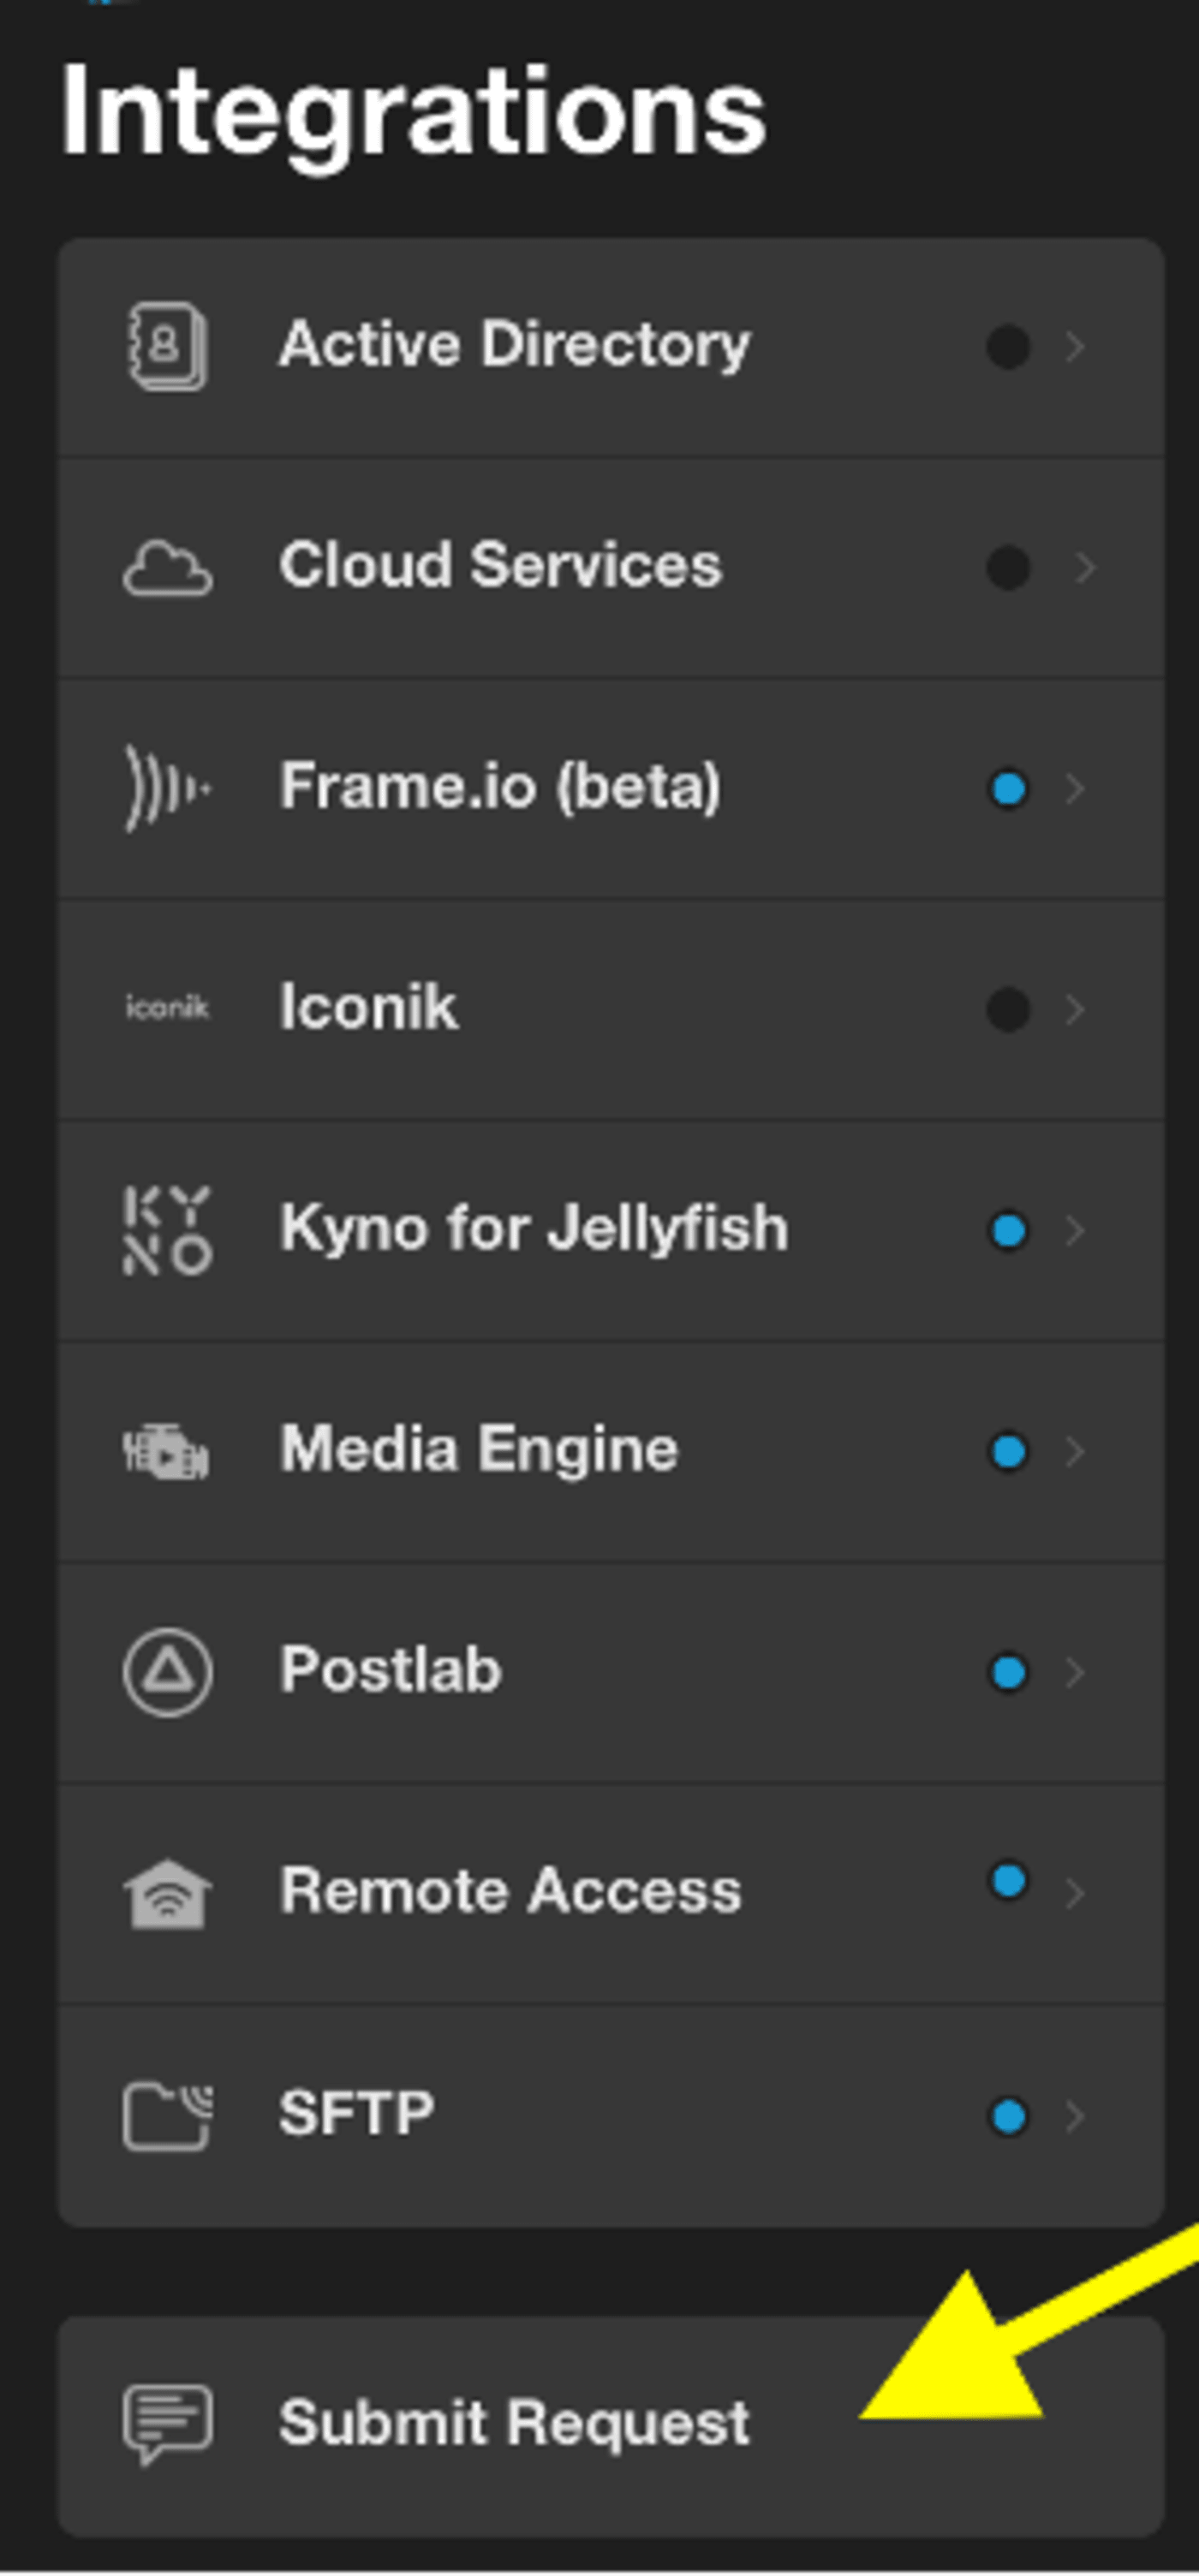
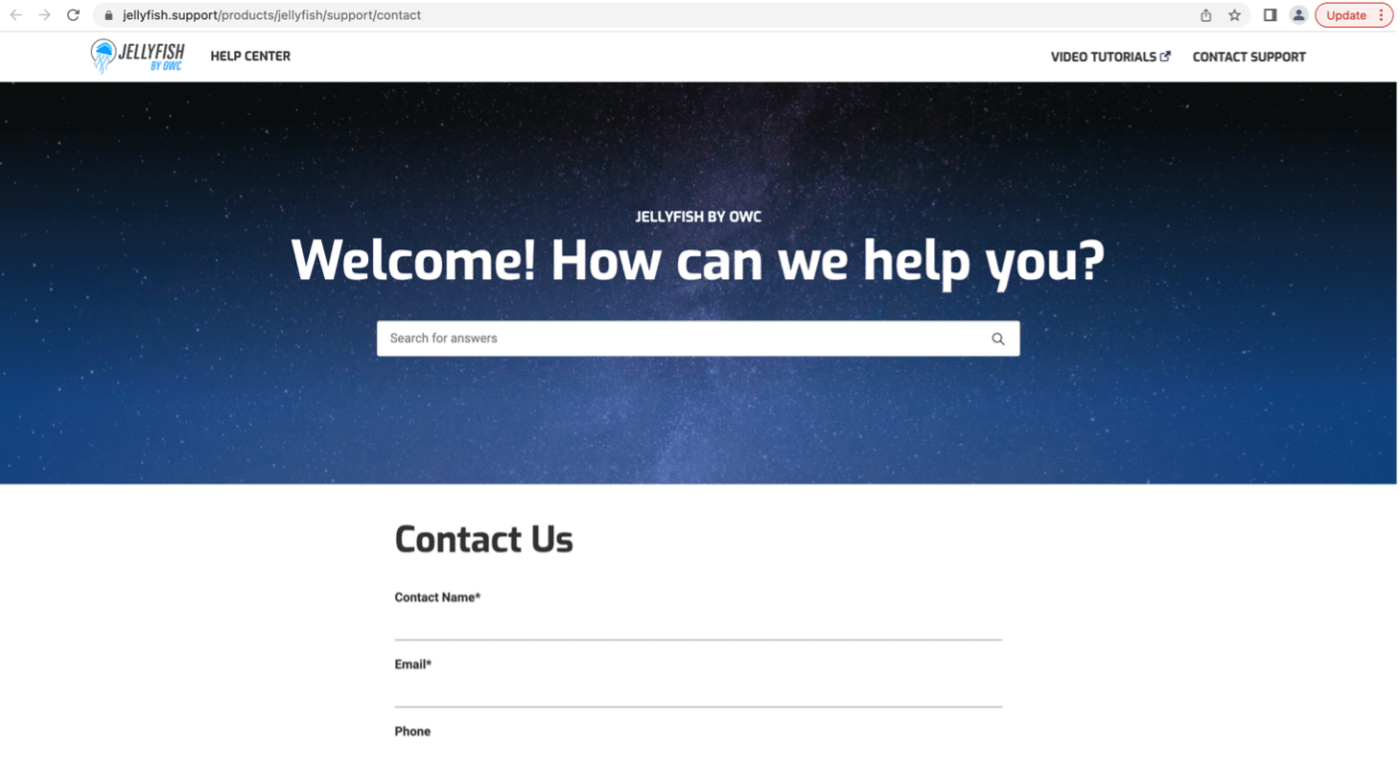
- Lastly, clicking “Submit Request” at the bottom of the left menu in Integrations will link you directly to the OWC Jellyfish support page. Here you can contact us directly and submit a support ticket, suggest an integration for our team to add, or simply search our knowledge database for troubleshooting and helpful topics.
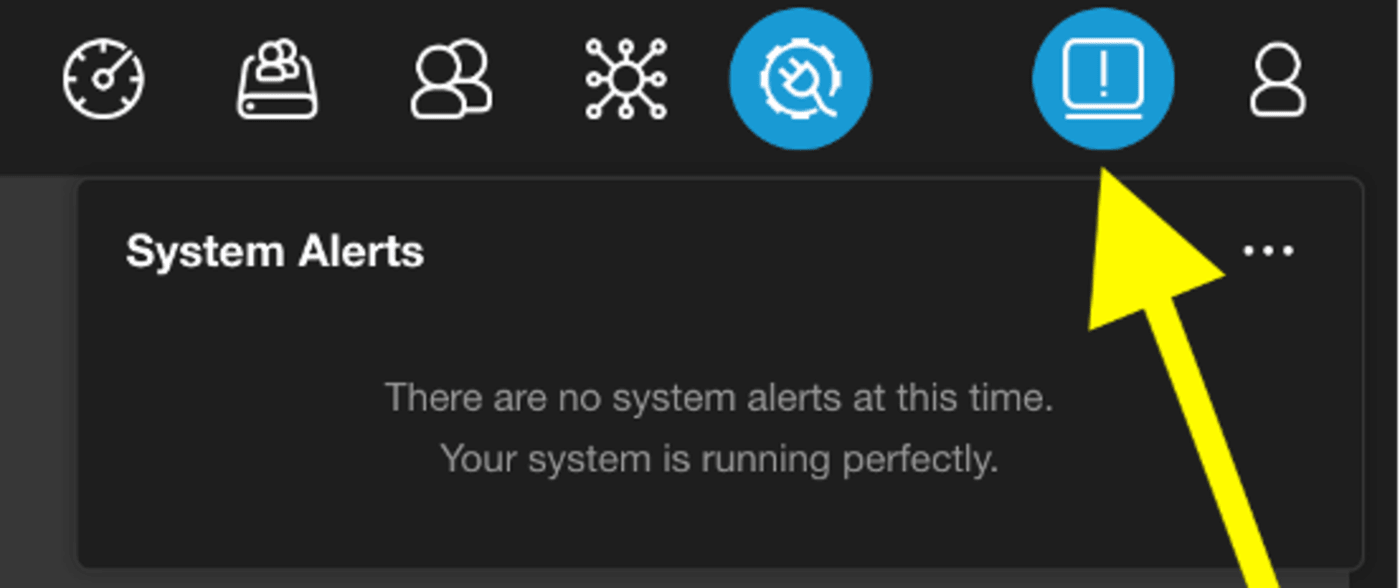
System Alerts
- Clicking on the System Alerts icon will show any issues needing attention that are prohibiting your OWC Jellyfish from running at optimal performance. Click the ellipses to select “Mark all as read” if you’ve already acknowledged any alerts and would like to clear your notifications.
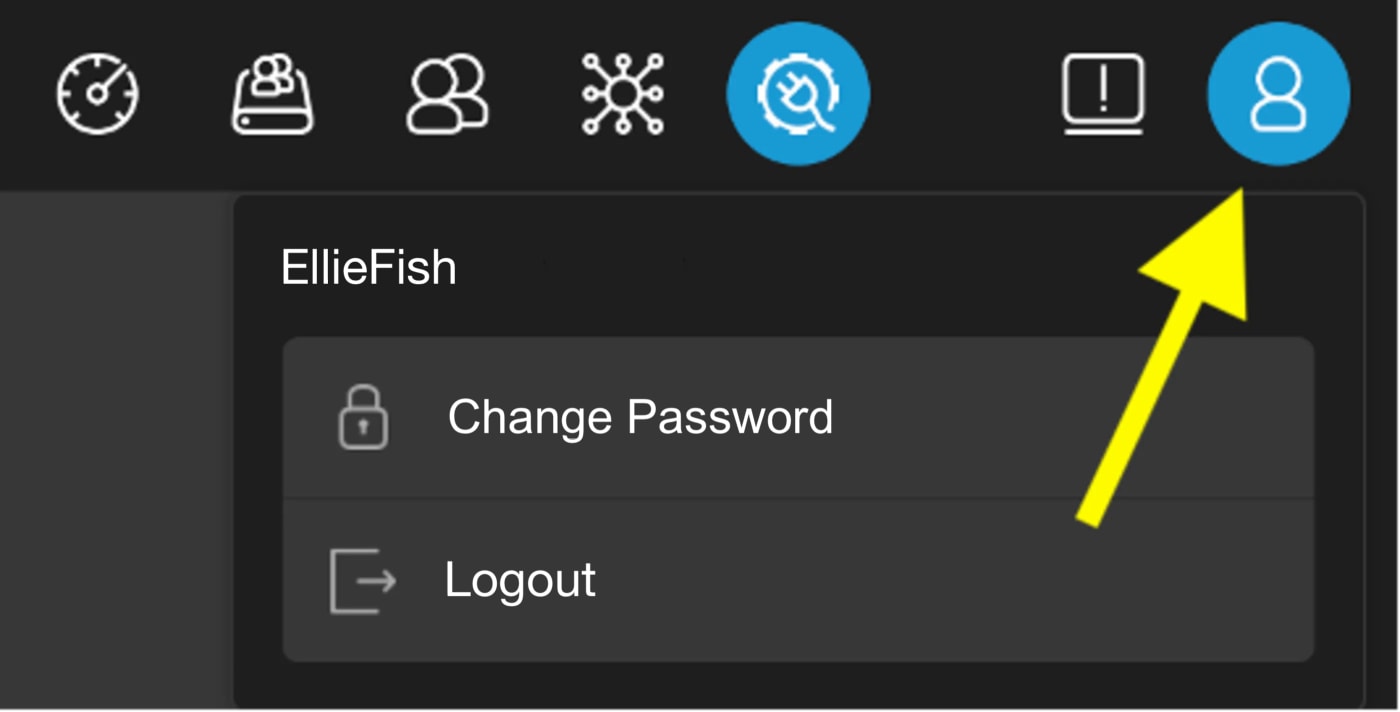
Profile
- This menu allows you to change your own password or logout if you need to do so.
Additional Resources
- Want to know more? Check out our online resources at https://www.lumaforge.com/tutorials and https://jellyfish.support/.